
Scaler is a global data analytics platform helping real estate companies improve their lowest performing assets. At Scaler, I launched 9 end-to-end features, created a design system, and redesigned the MVP.
SCALER
2022 - 2023
ROLE
Product Design, Design Systems
CREDITS
Zlatan Menkovic, Founder and CEO
Tamara Milakovic, Designer
I. ESG INSIGHTS
ESG insights gives users a deeper look into every asset in their portfolio, broken down by resource type. For this project, I added month over month UI for Energy Use Intensity and Total Consumption data, a new UI for displaying assets with missing data coverage, a new data estimations feature, improved graph pop-up hover states, and new platform filters.
PREVIOUS EXPERIENCE
NEW EXPERIENCE
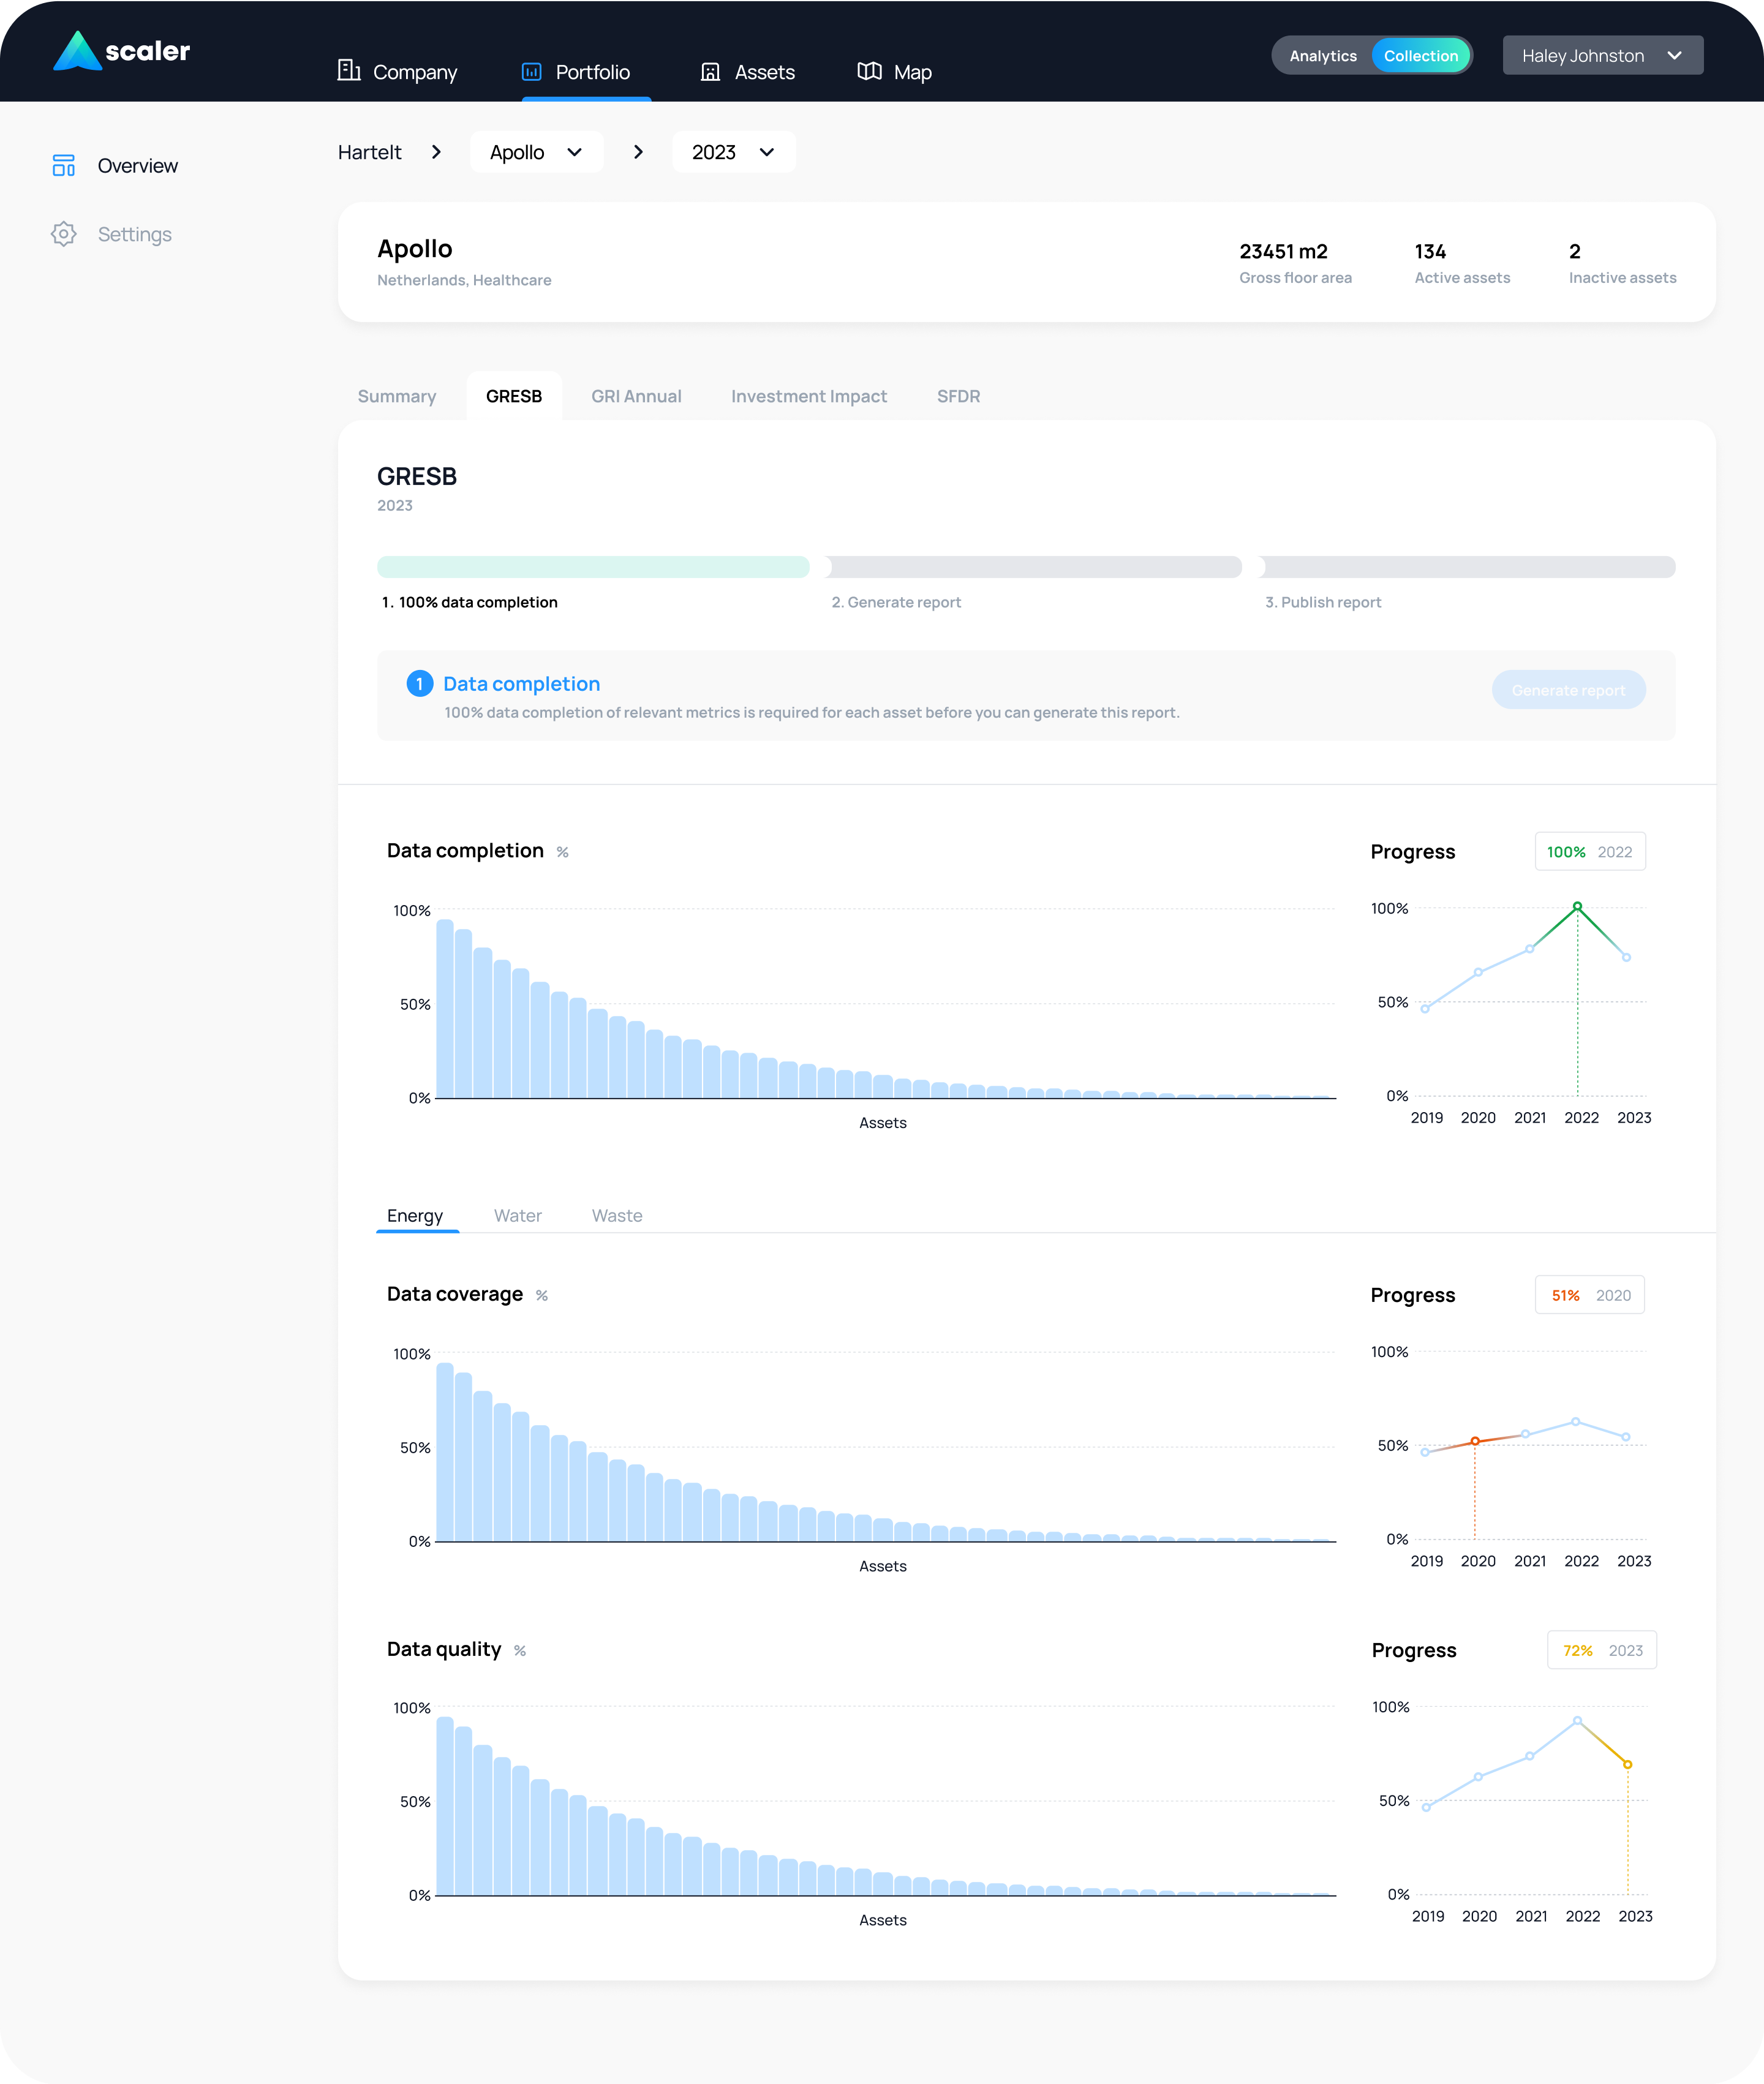
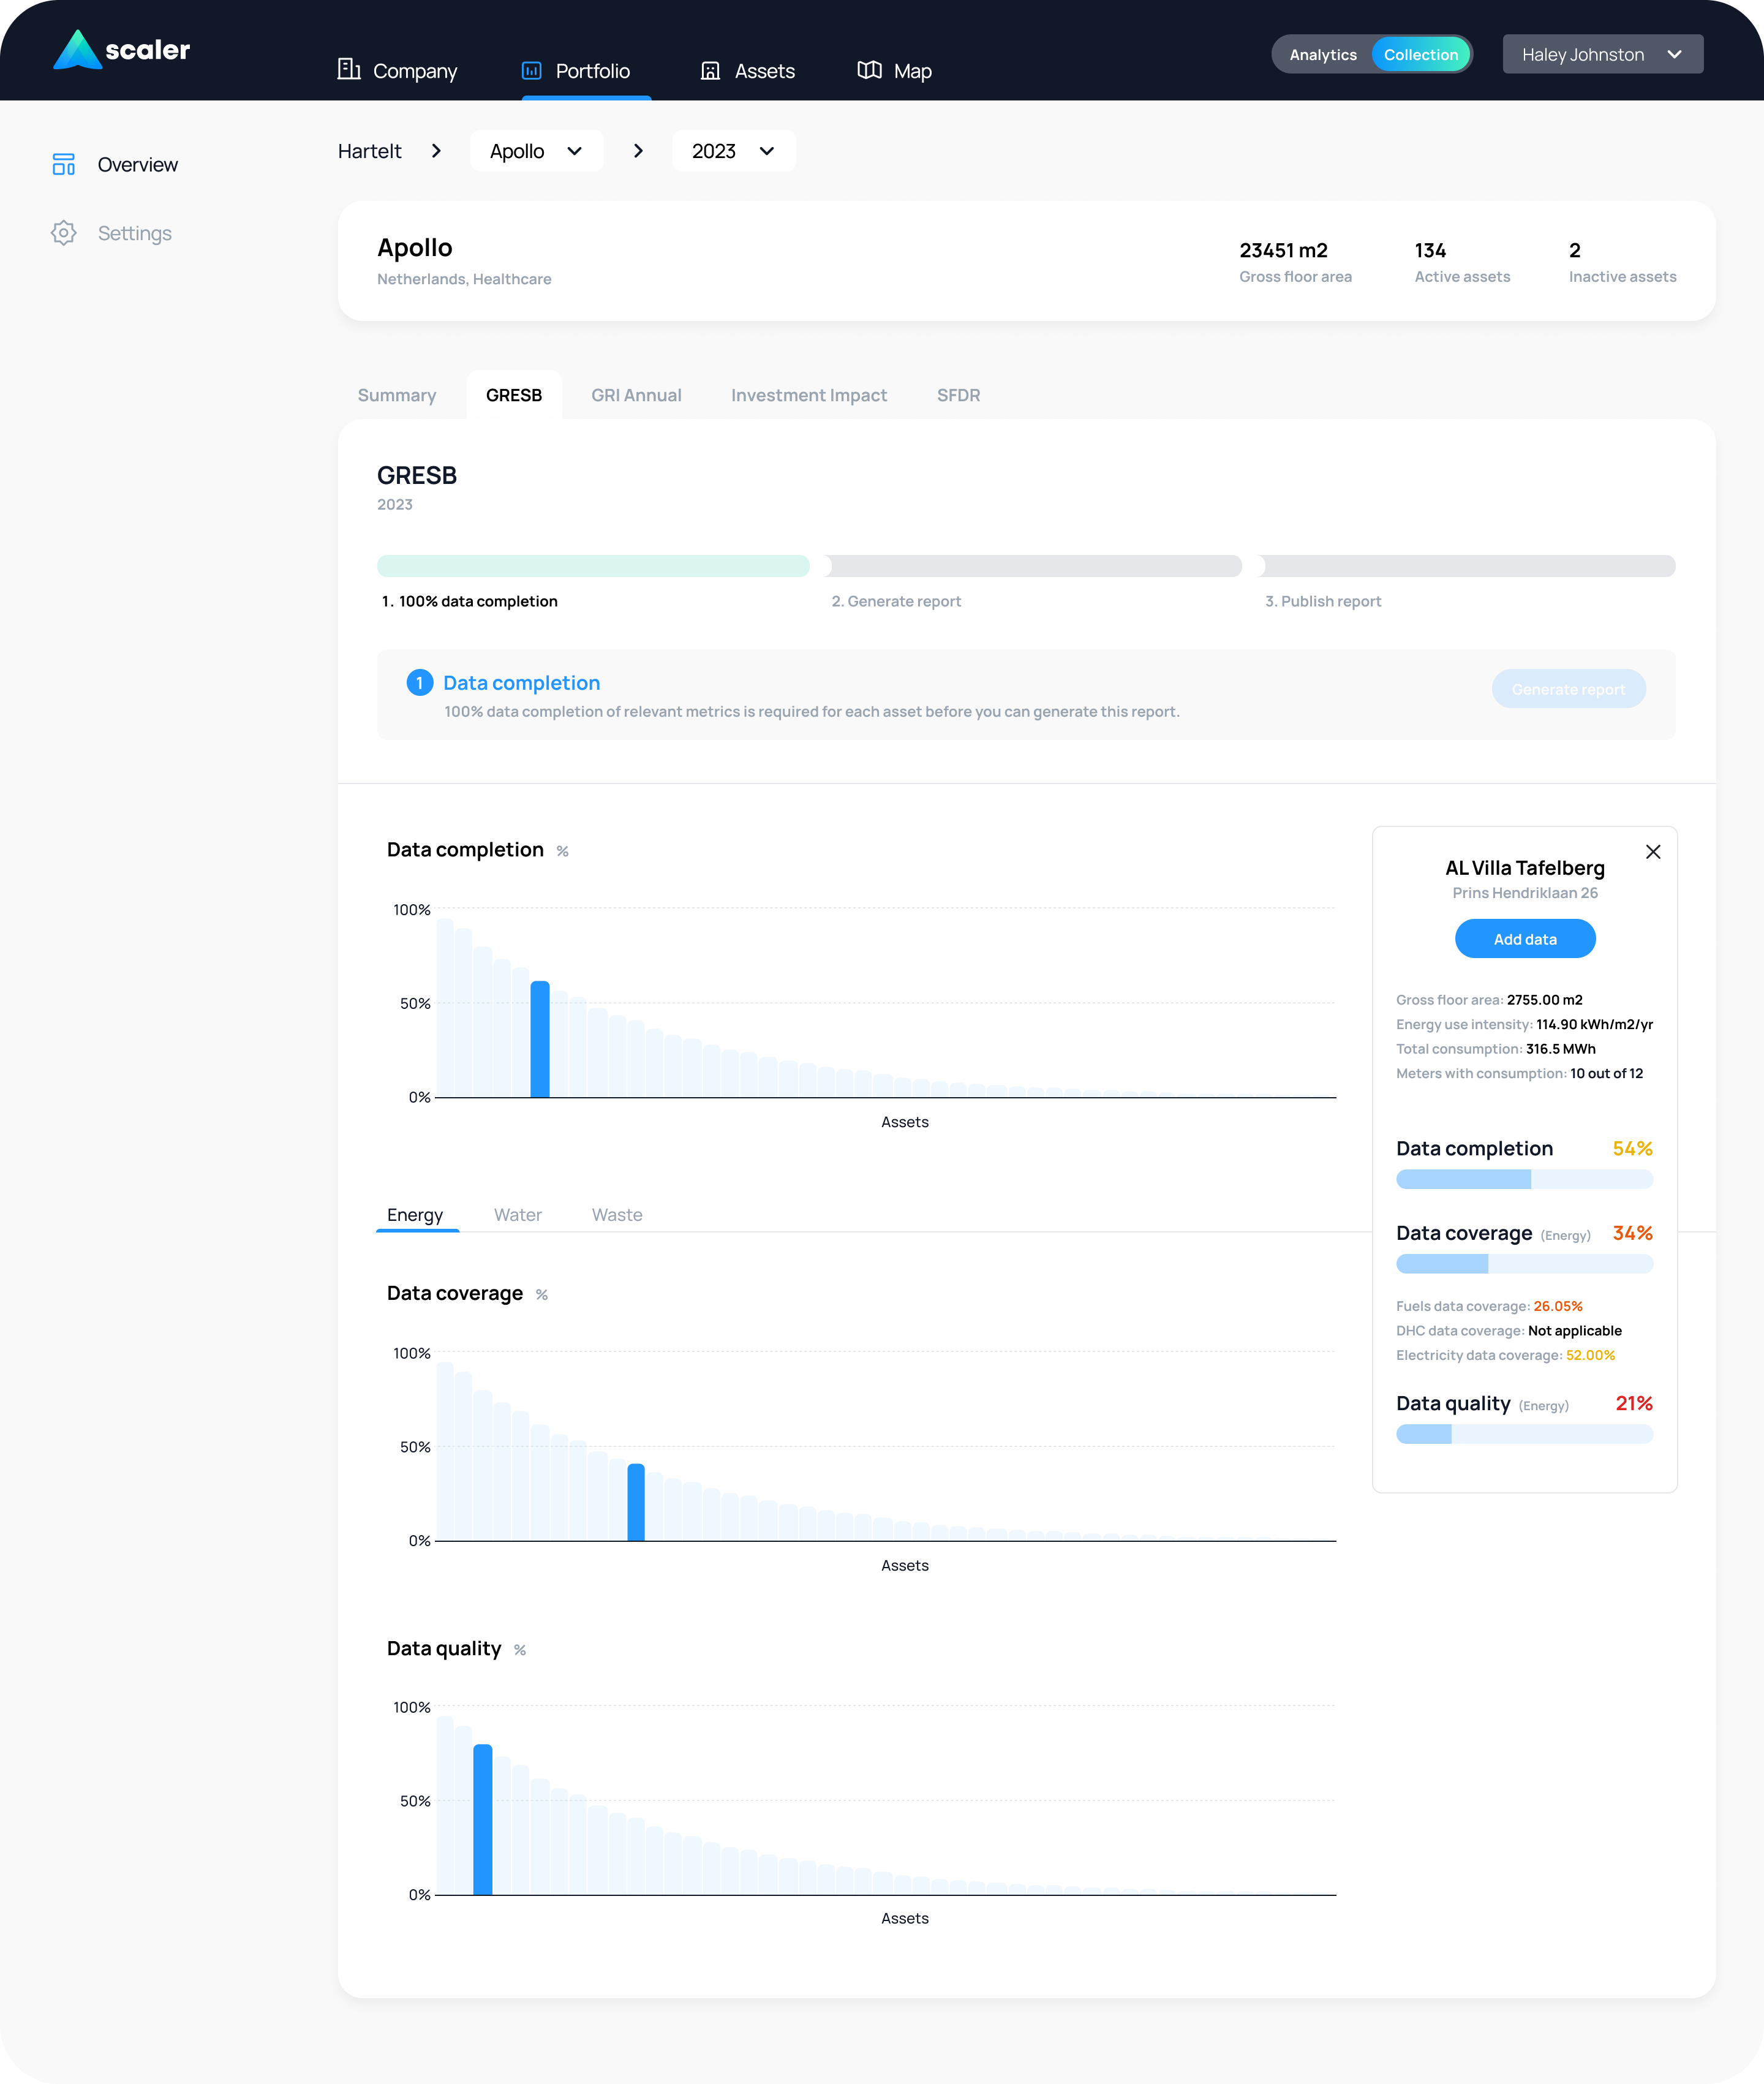
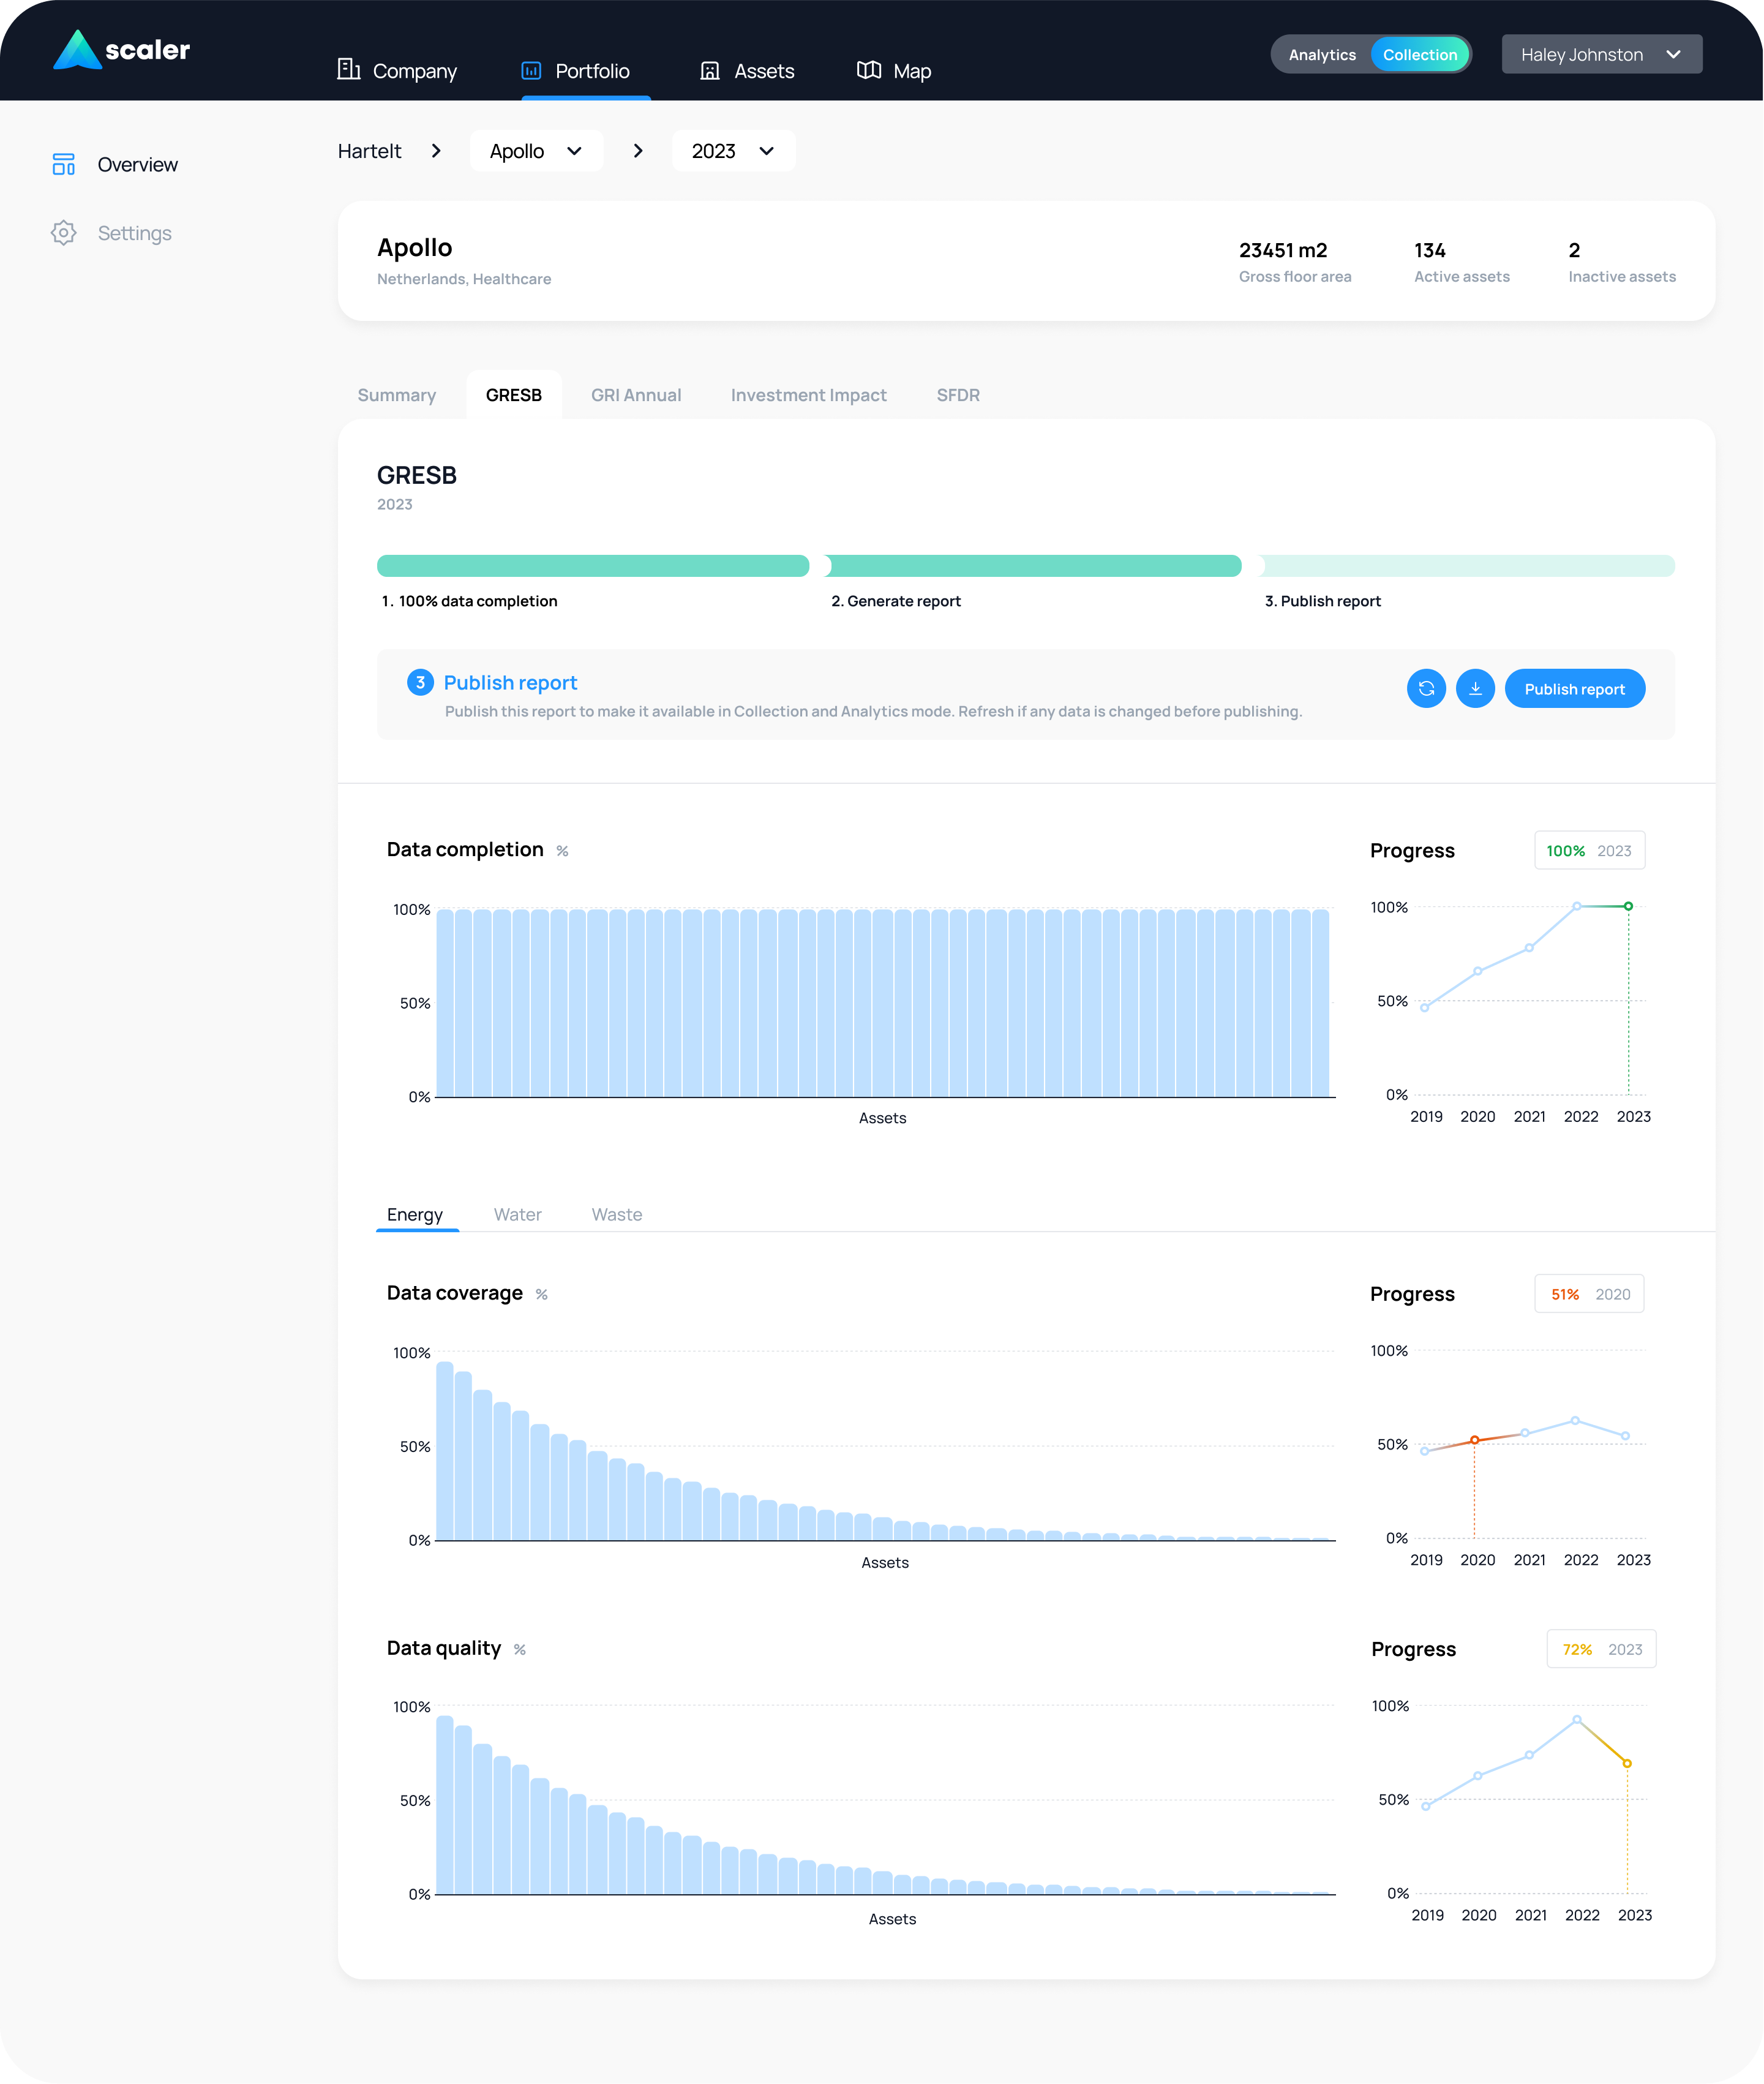
II. GOVERNMENT REPORTING
Annual government reporting is mandatory for many of Scaler's users. In order to generate reports, all assets (buildings) must have 100% data completion for the reporting year. This is often a huge obstacle for users with large portfolios - digging through hundreds of assets to find which key data points are missing for individual buildings is extremely inefficient.
With Scaler's reporting feature, I designed a way for users to see exactly which assets have not reached 100% data completion and then directly take action to add data for those specific assets. Once complete, users can then generate the necessary reports in the same view.
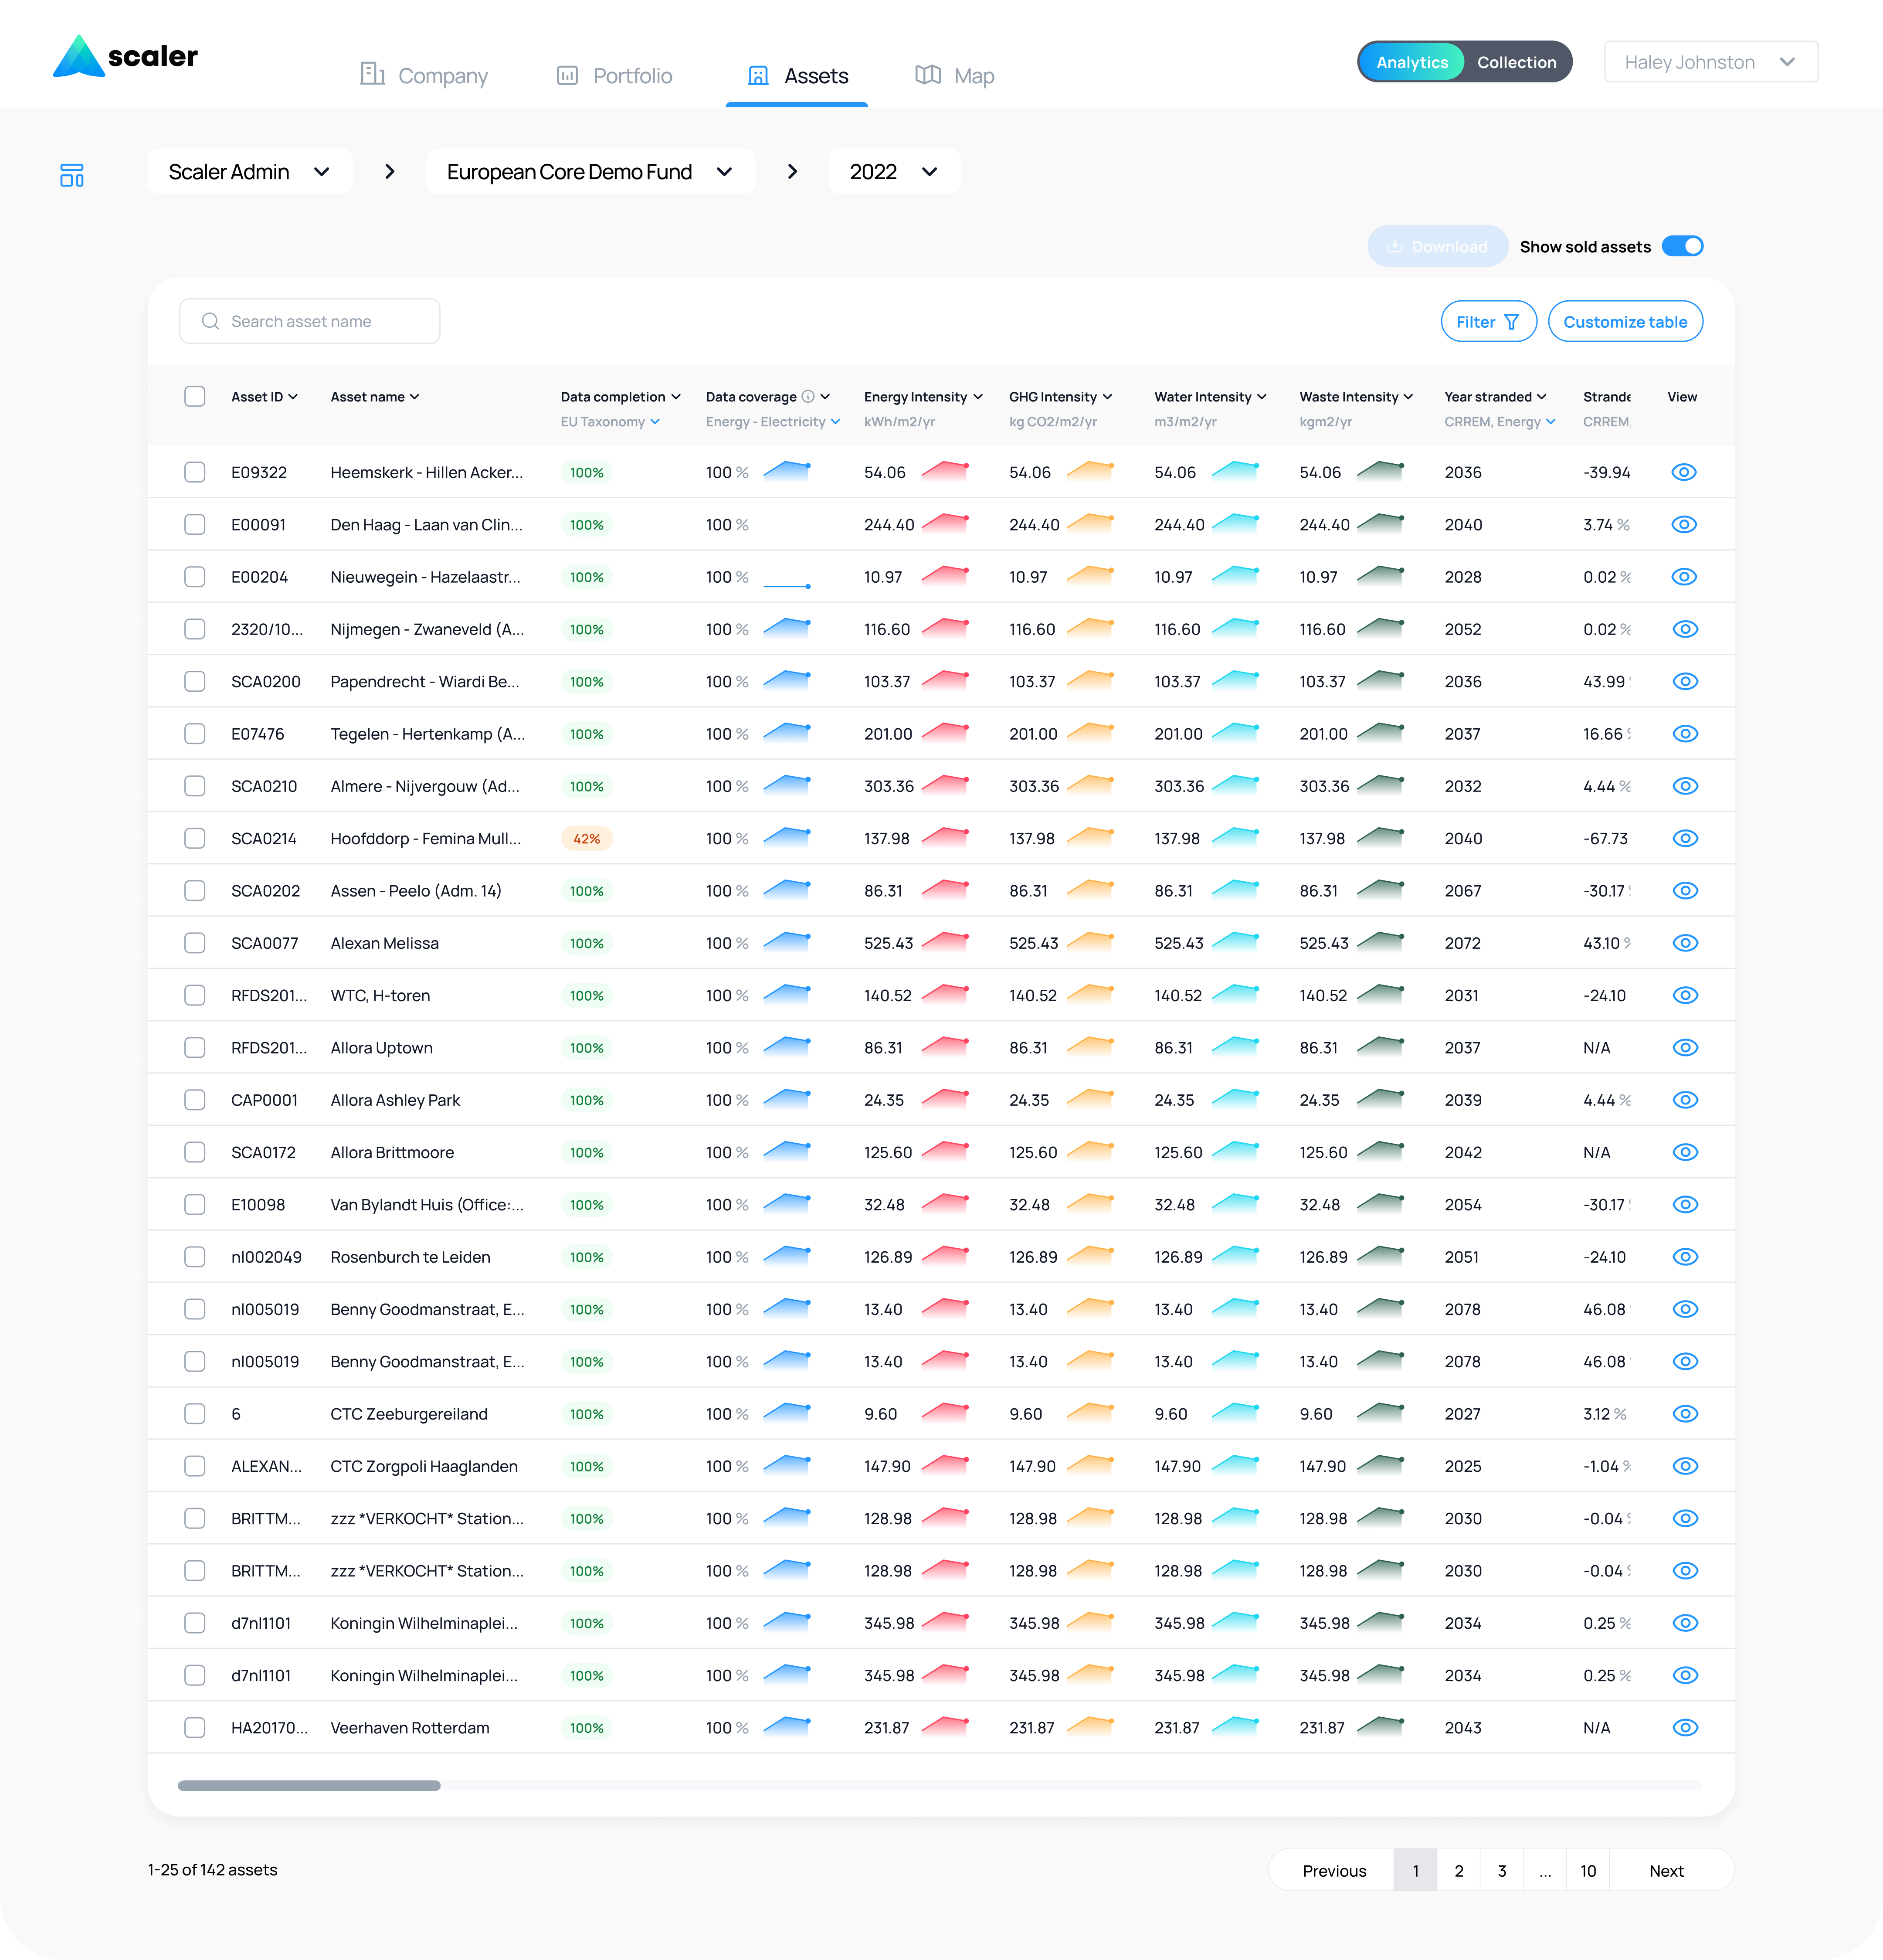
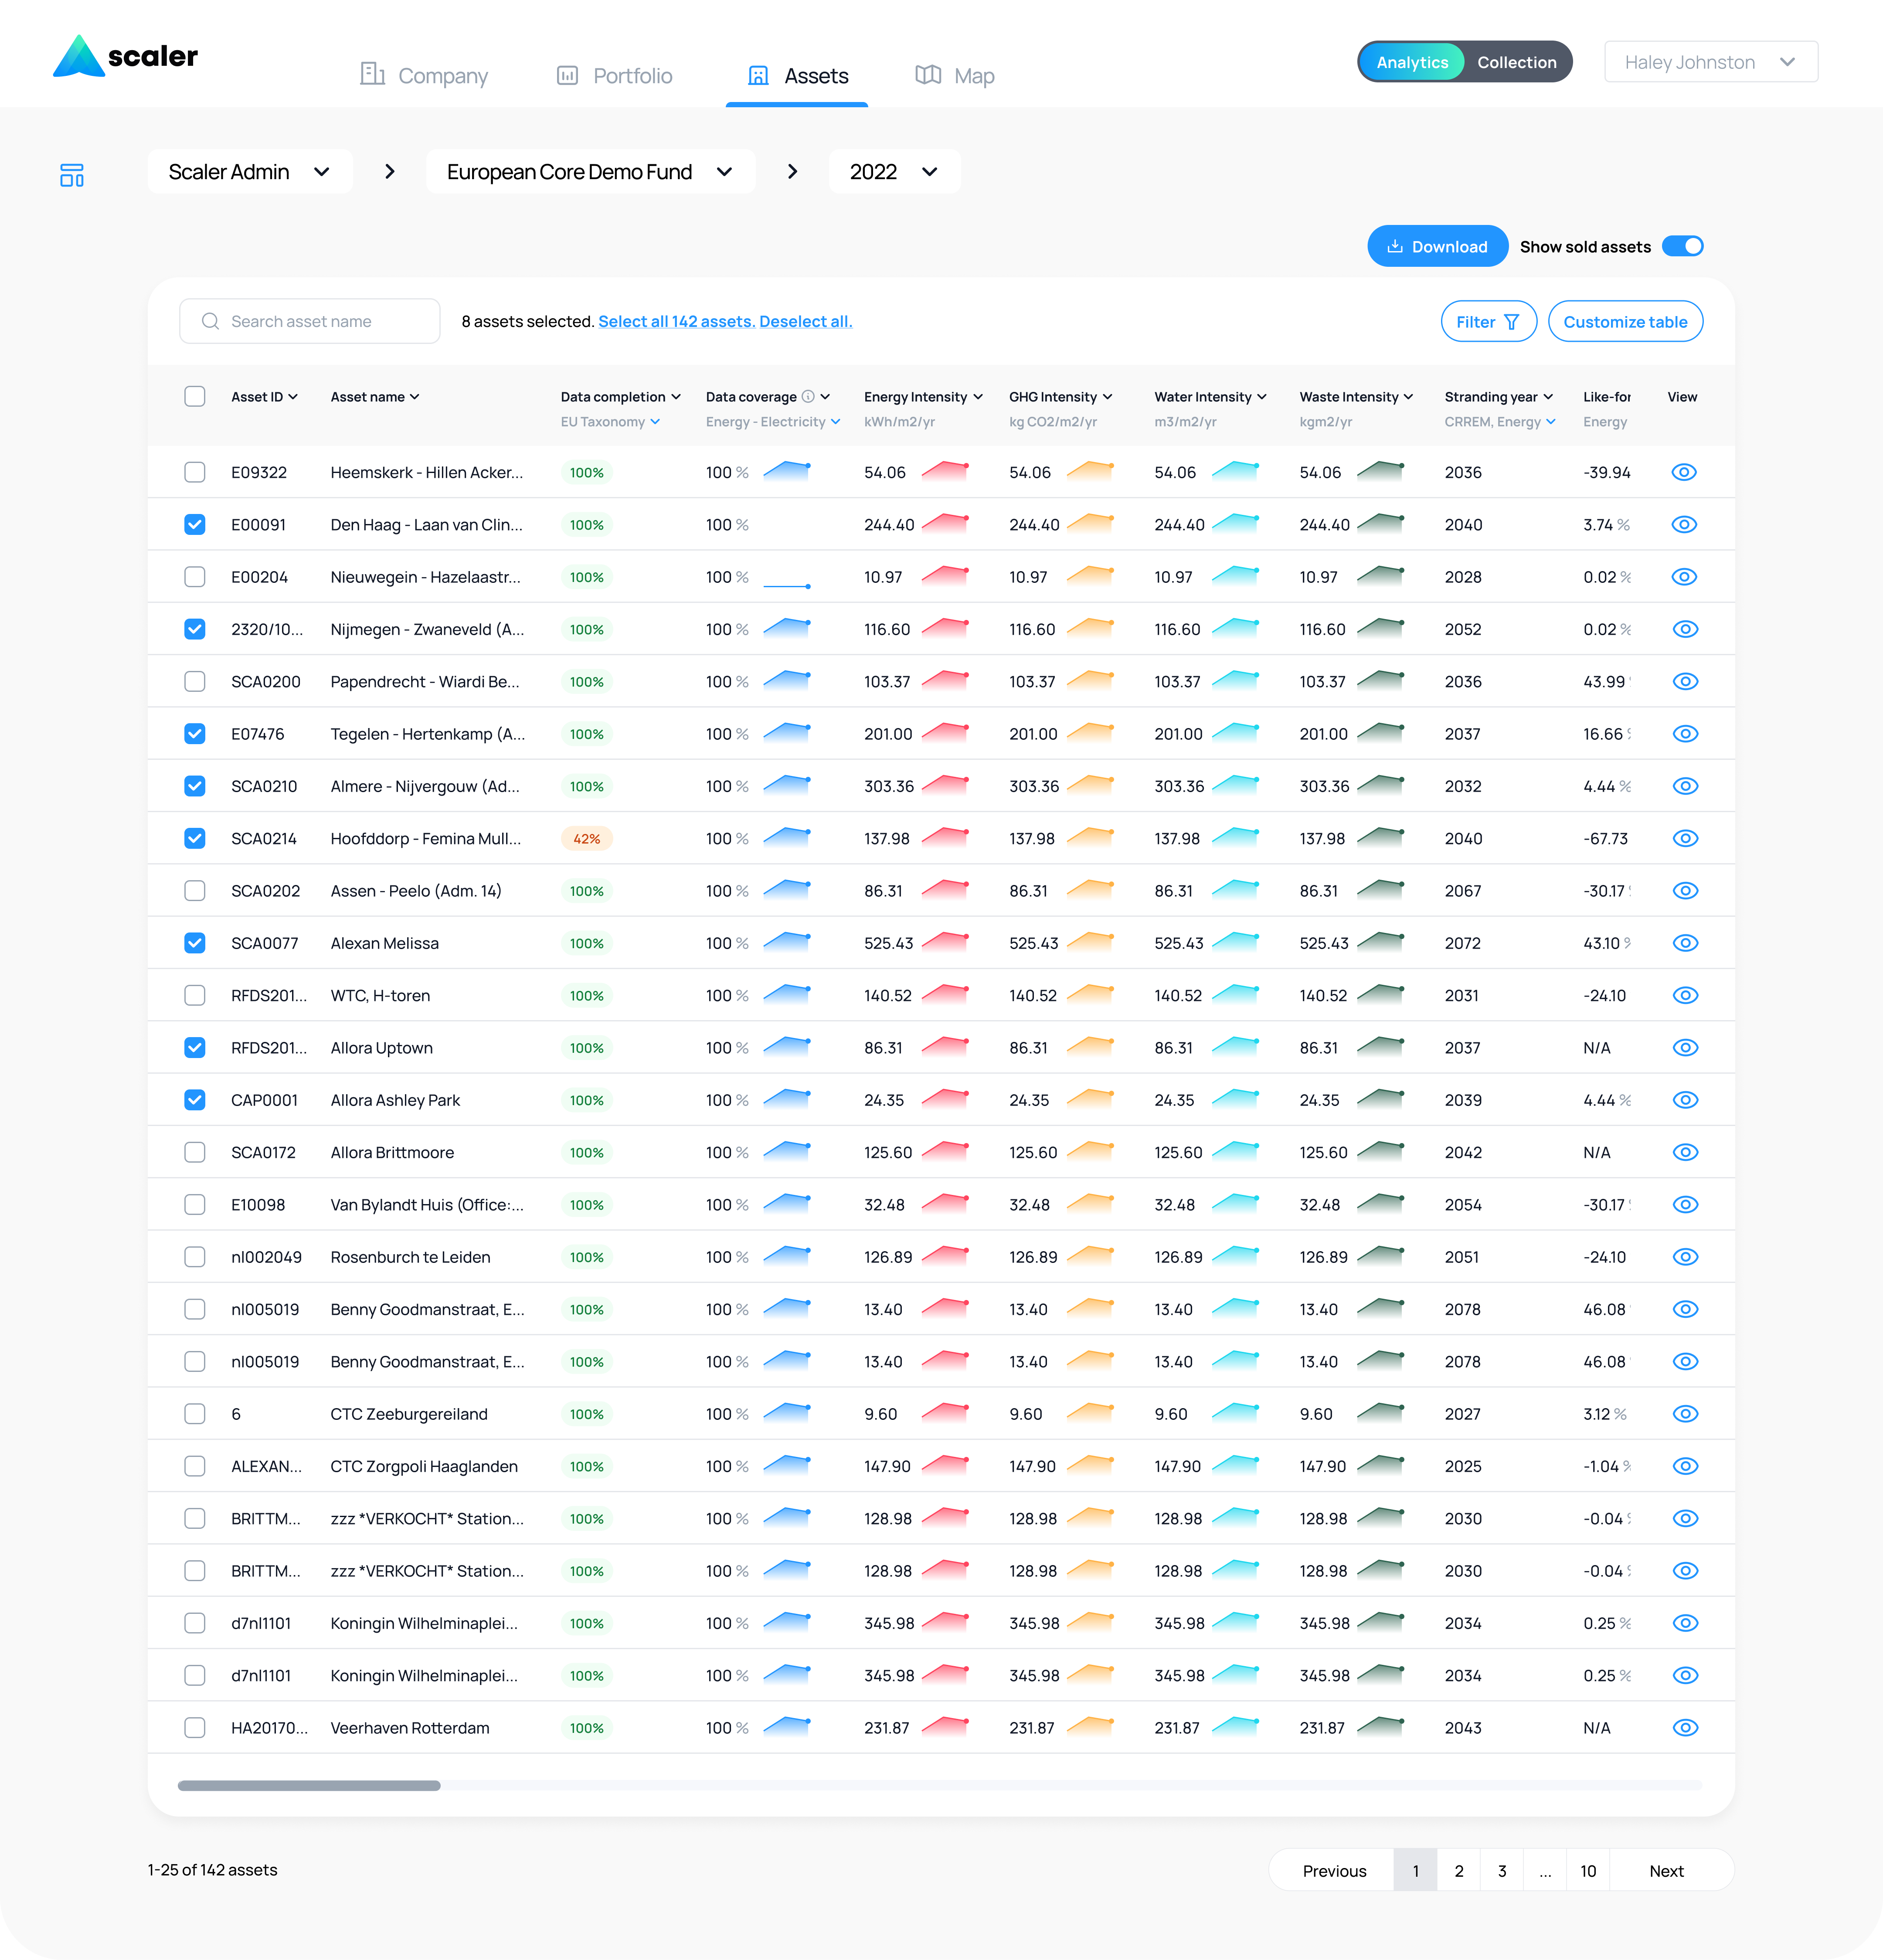
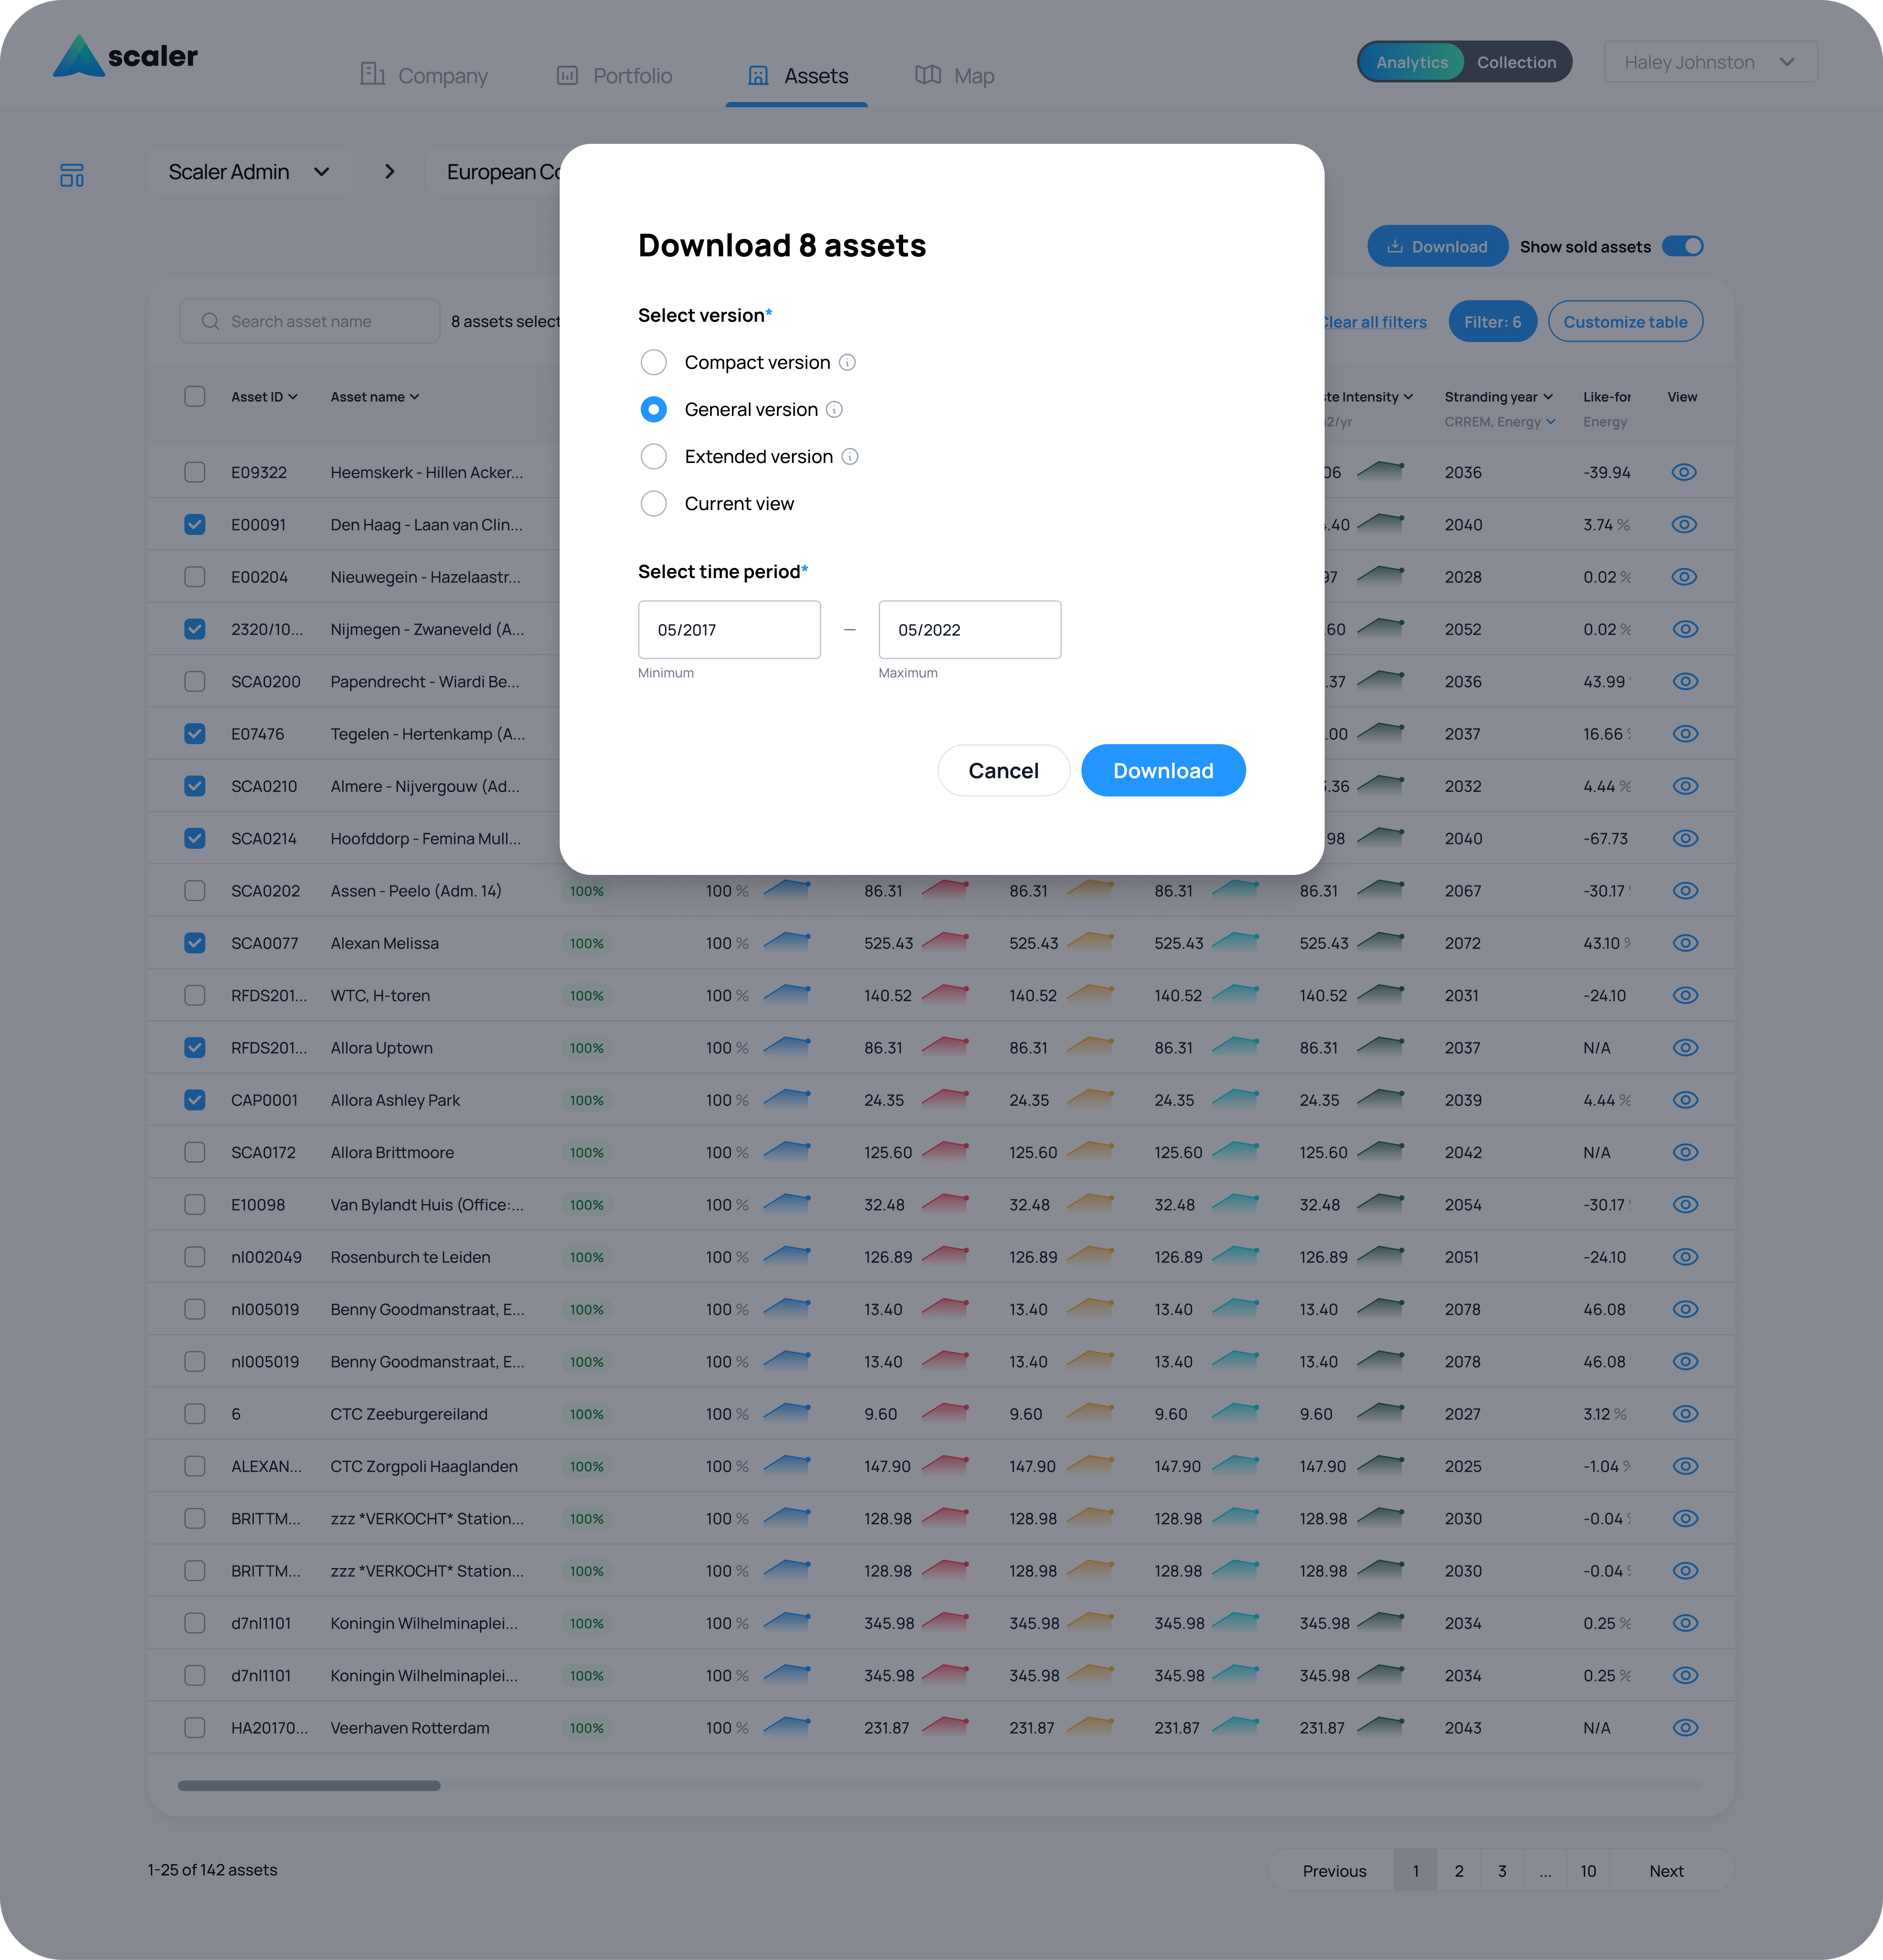
III. ASSET ANALYTICS TABLE
Through user interviews, we uncovered a large need for users to be able to export assets either individually, grouped together, or as an entire portfolio. I redesigned our existing Analytics Asset Table and added an exporting feature.
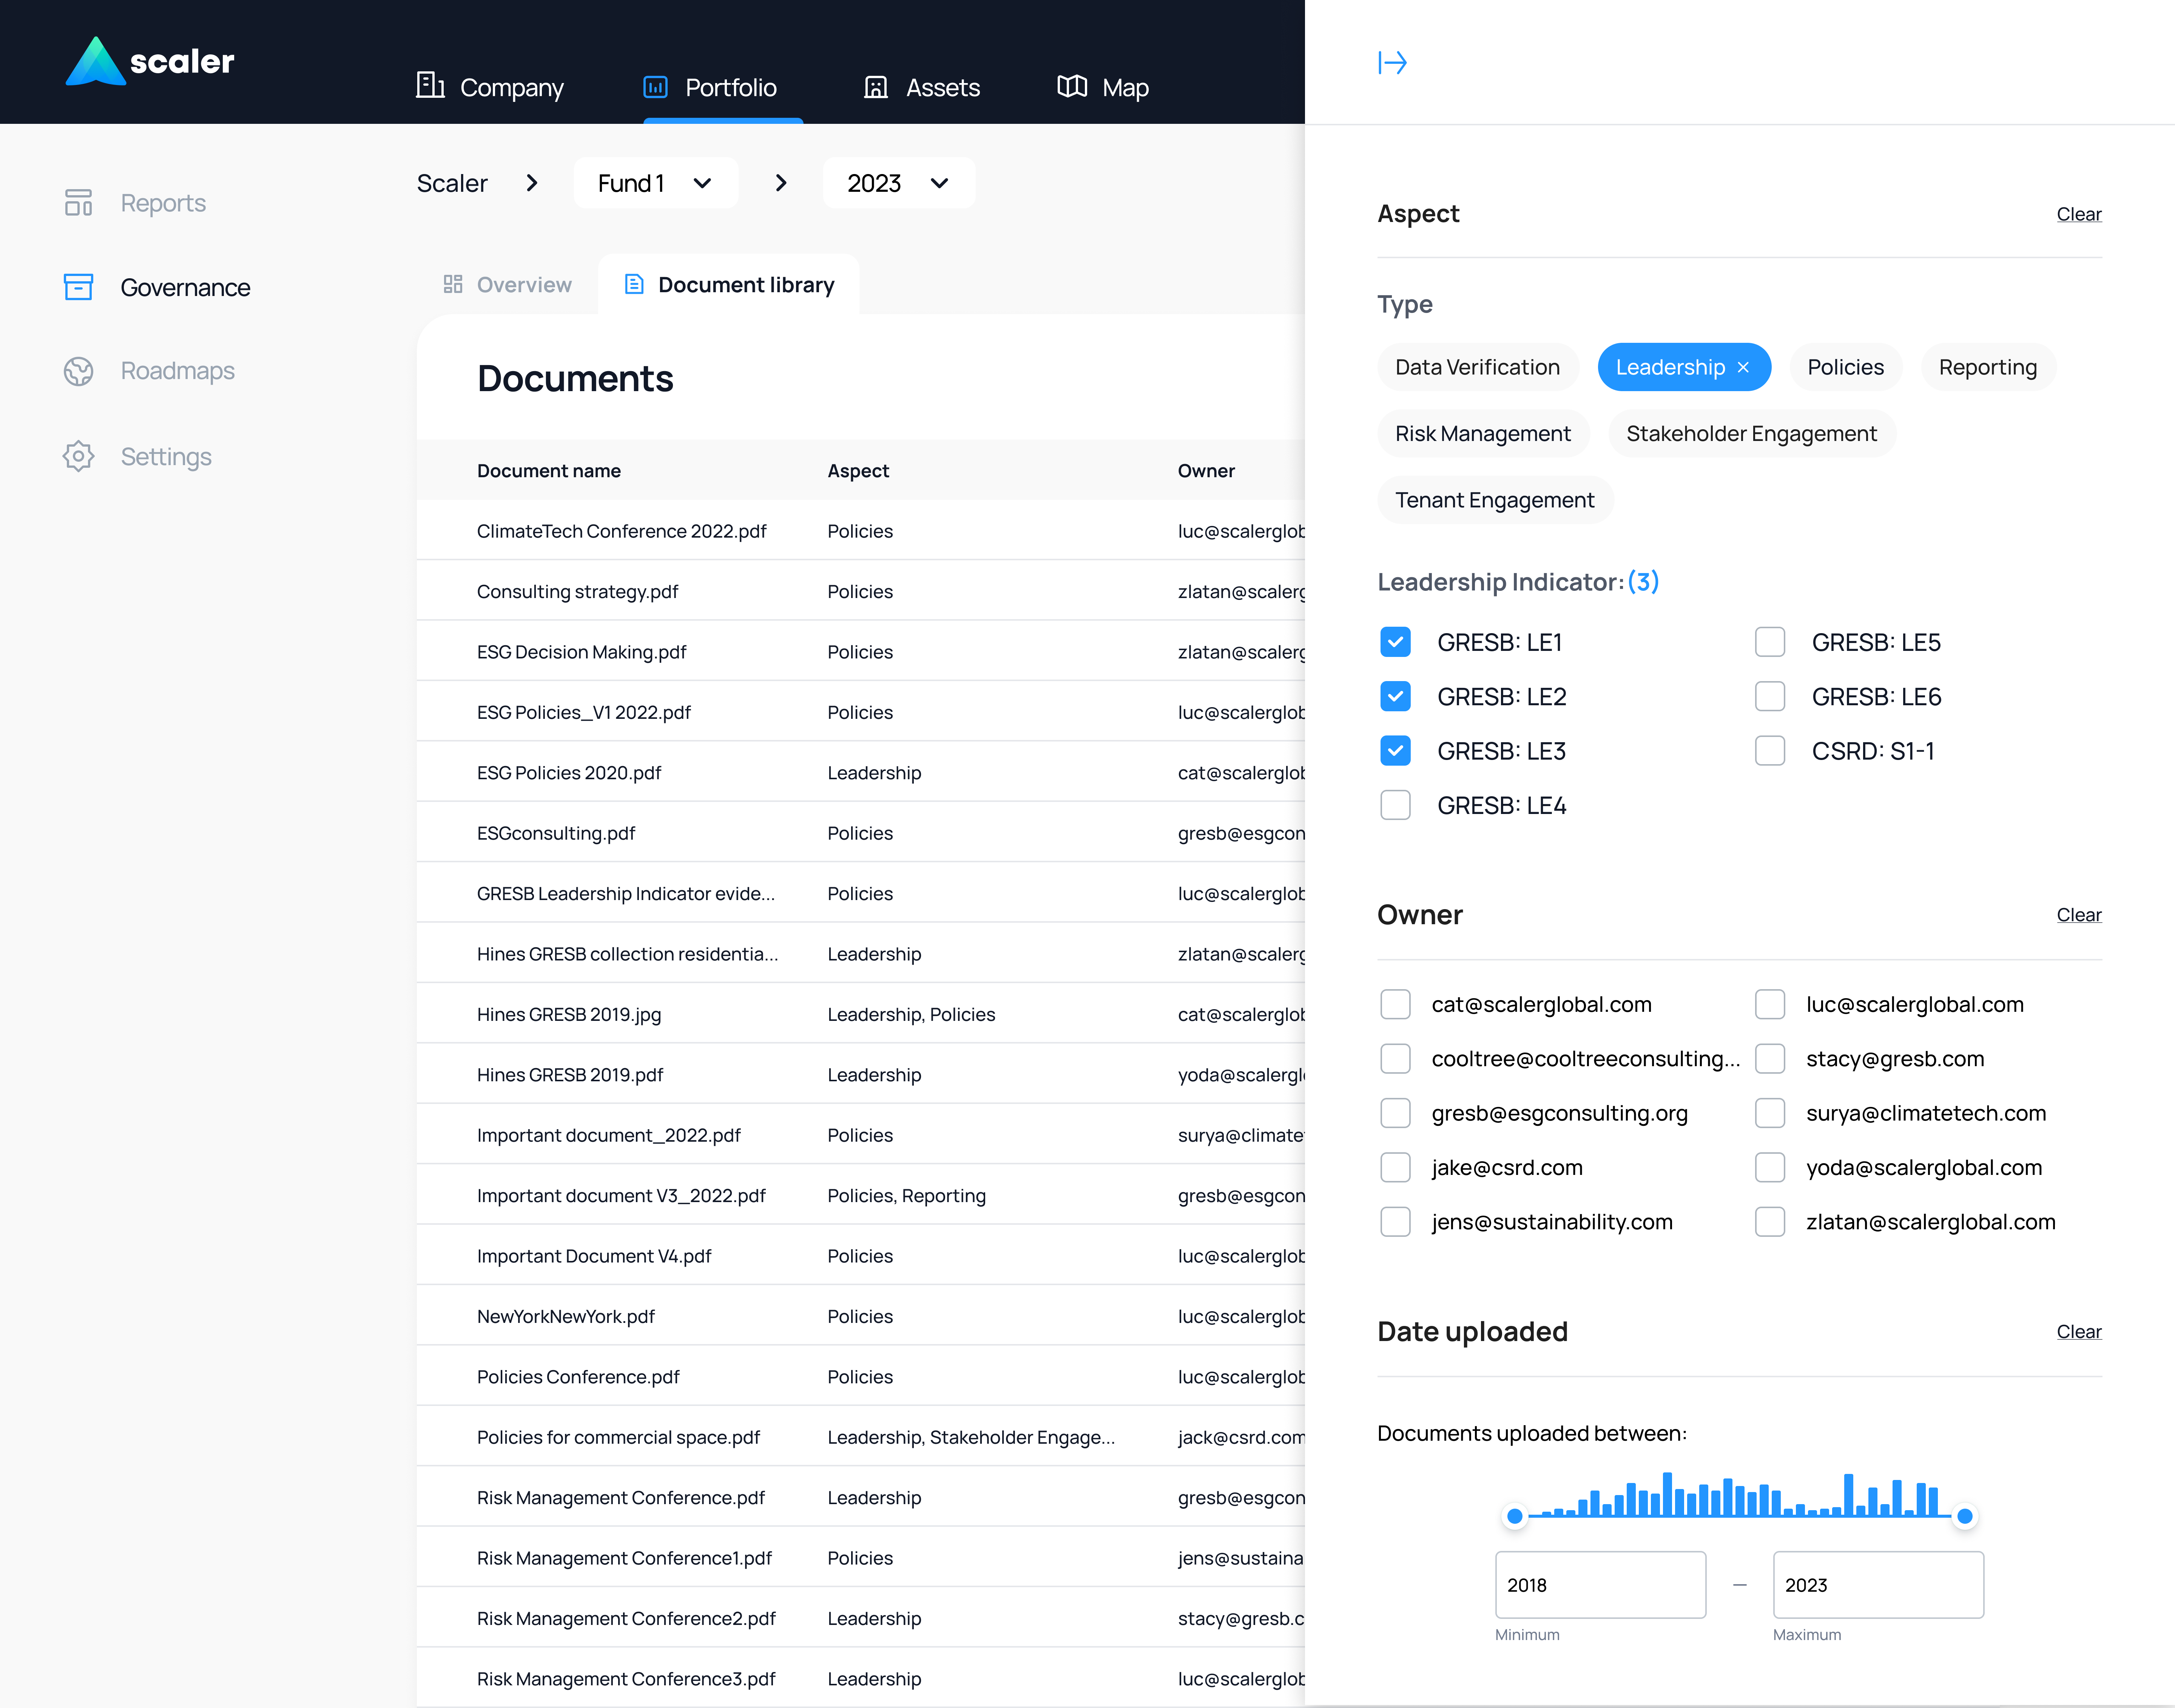
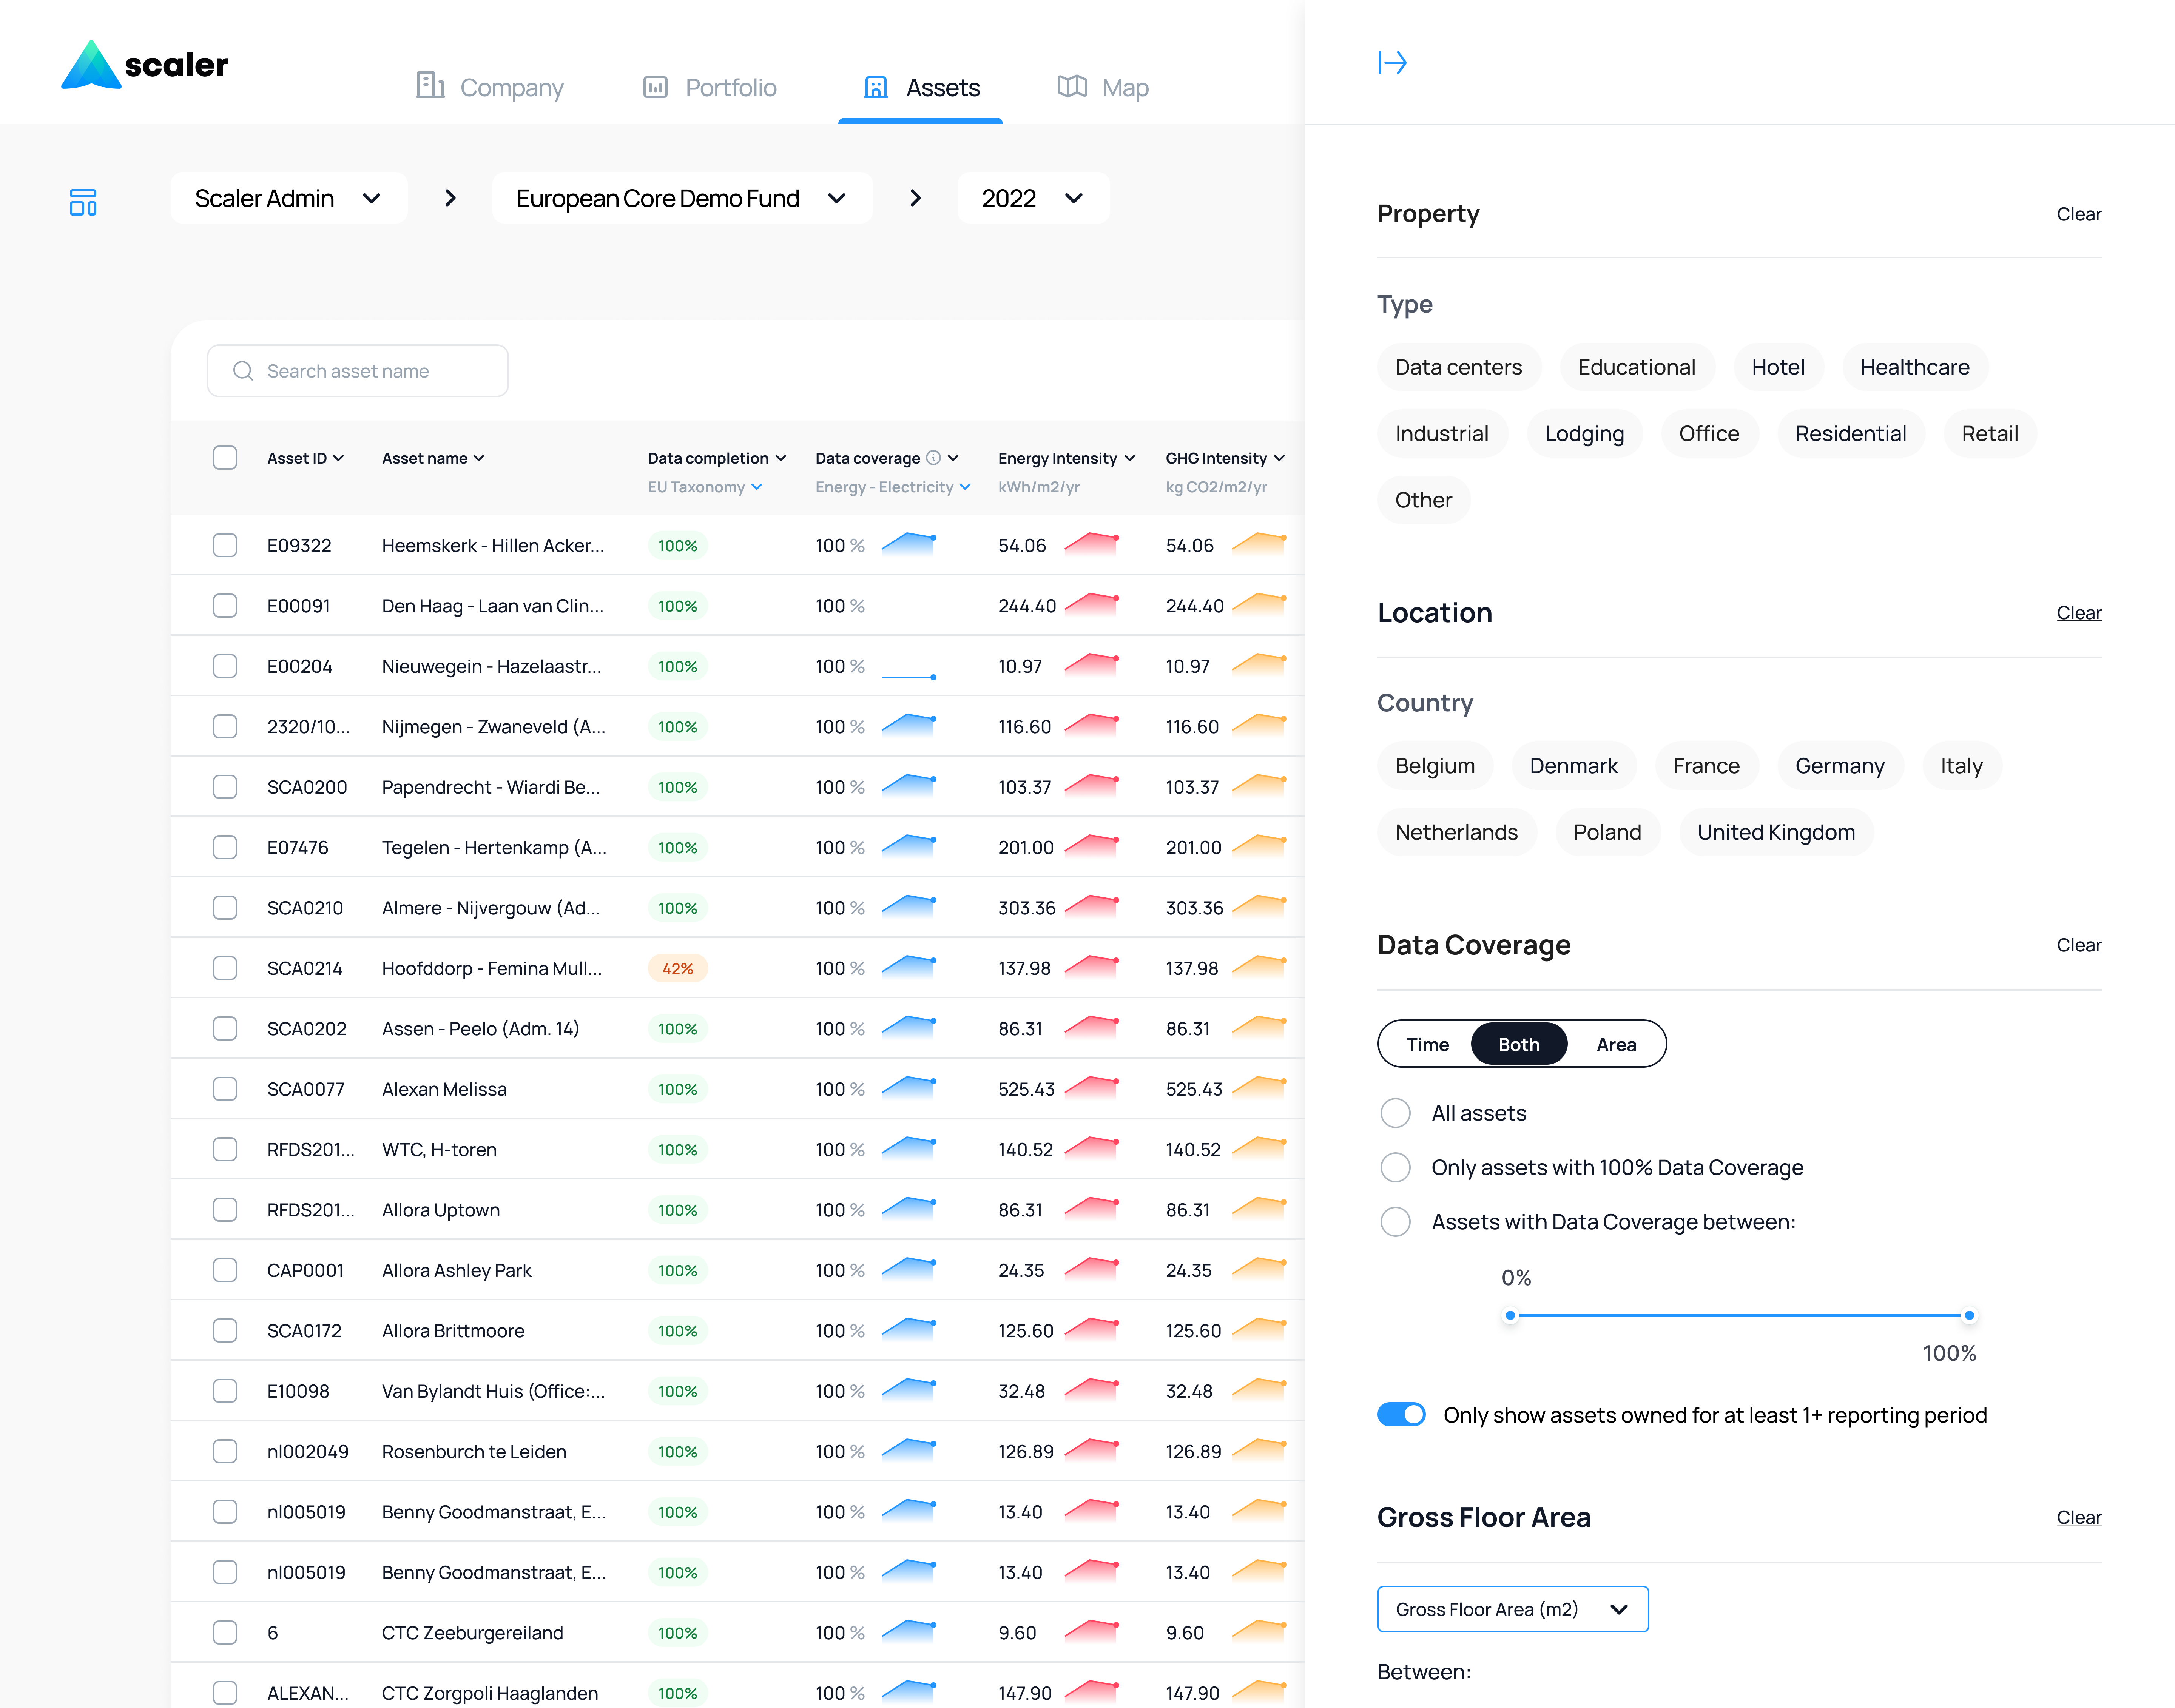
IV. PLATFORM FILTERS
I updated our platform filters from a minimal in-line feature above data tables to a scalable drawer layout that could be applied platform wide.
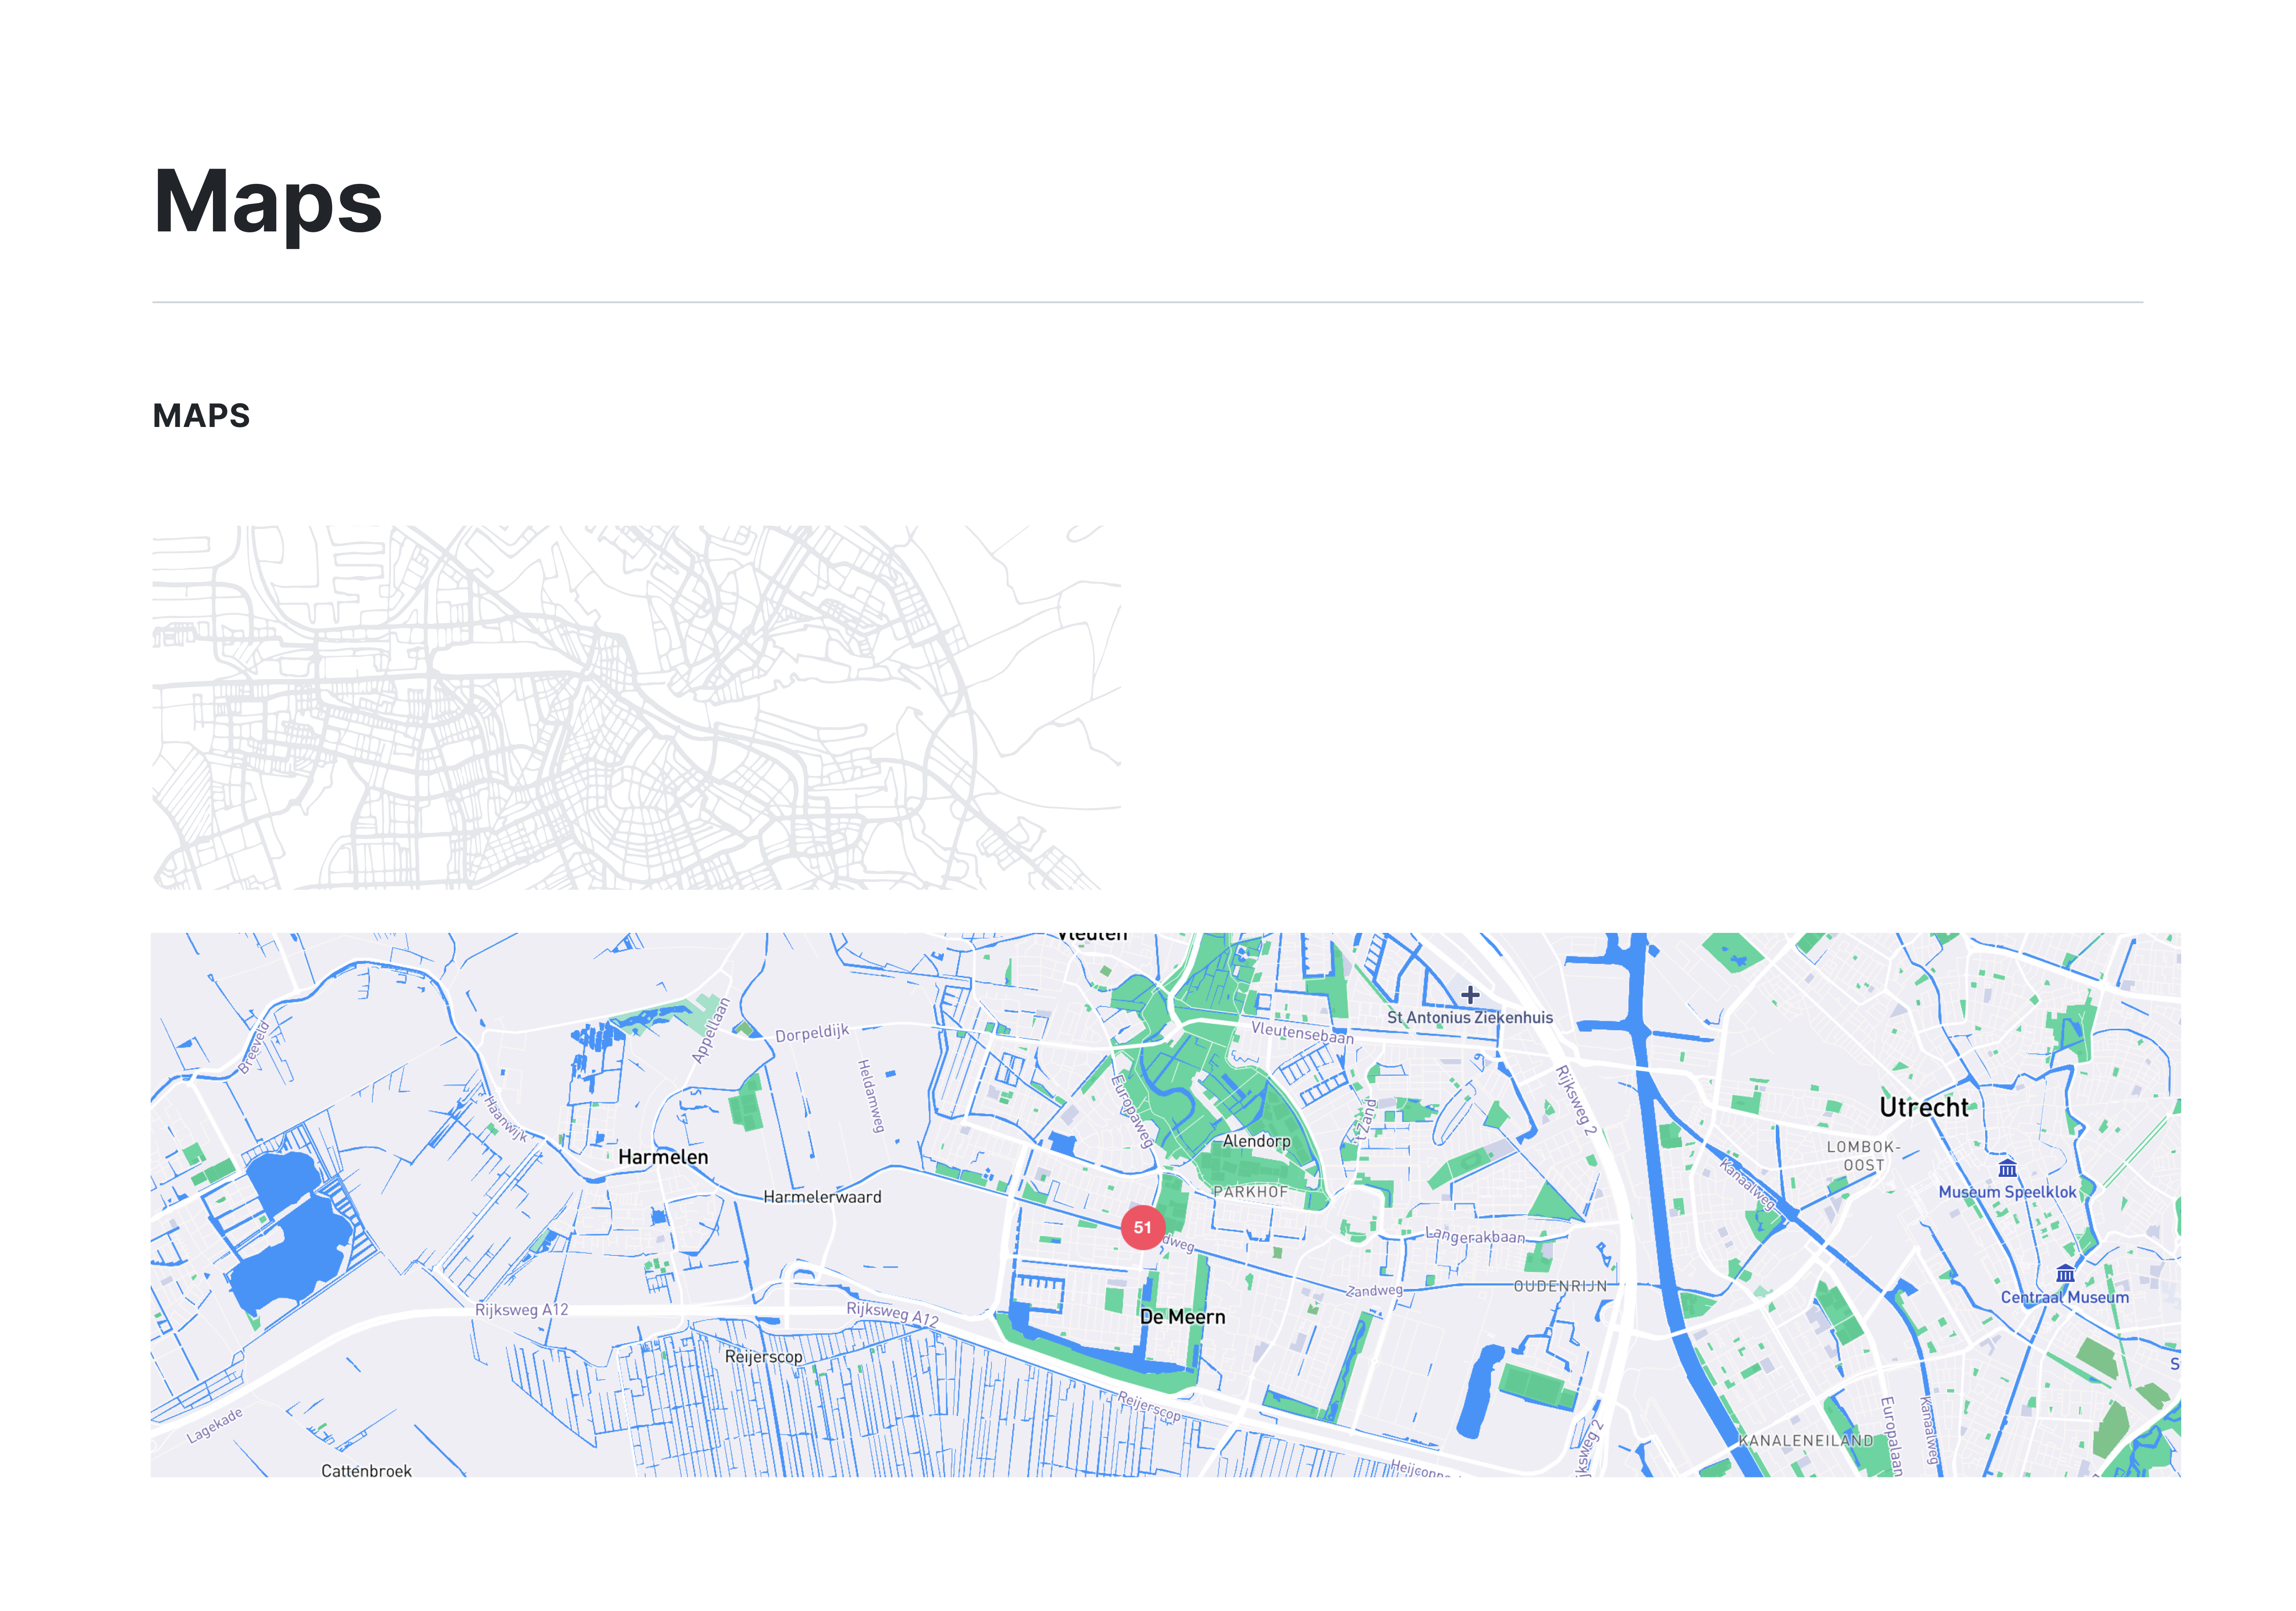
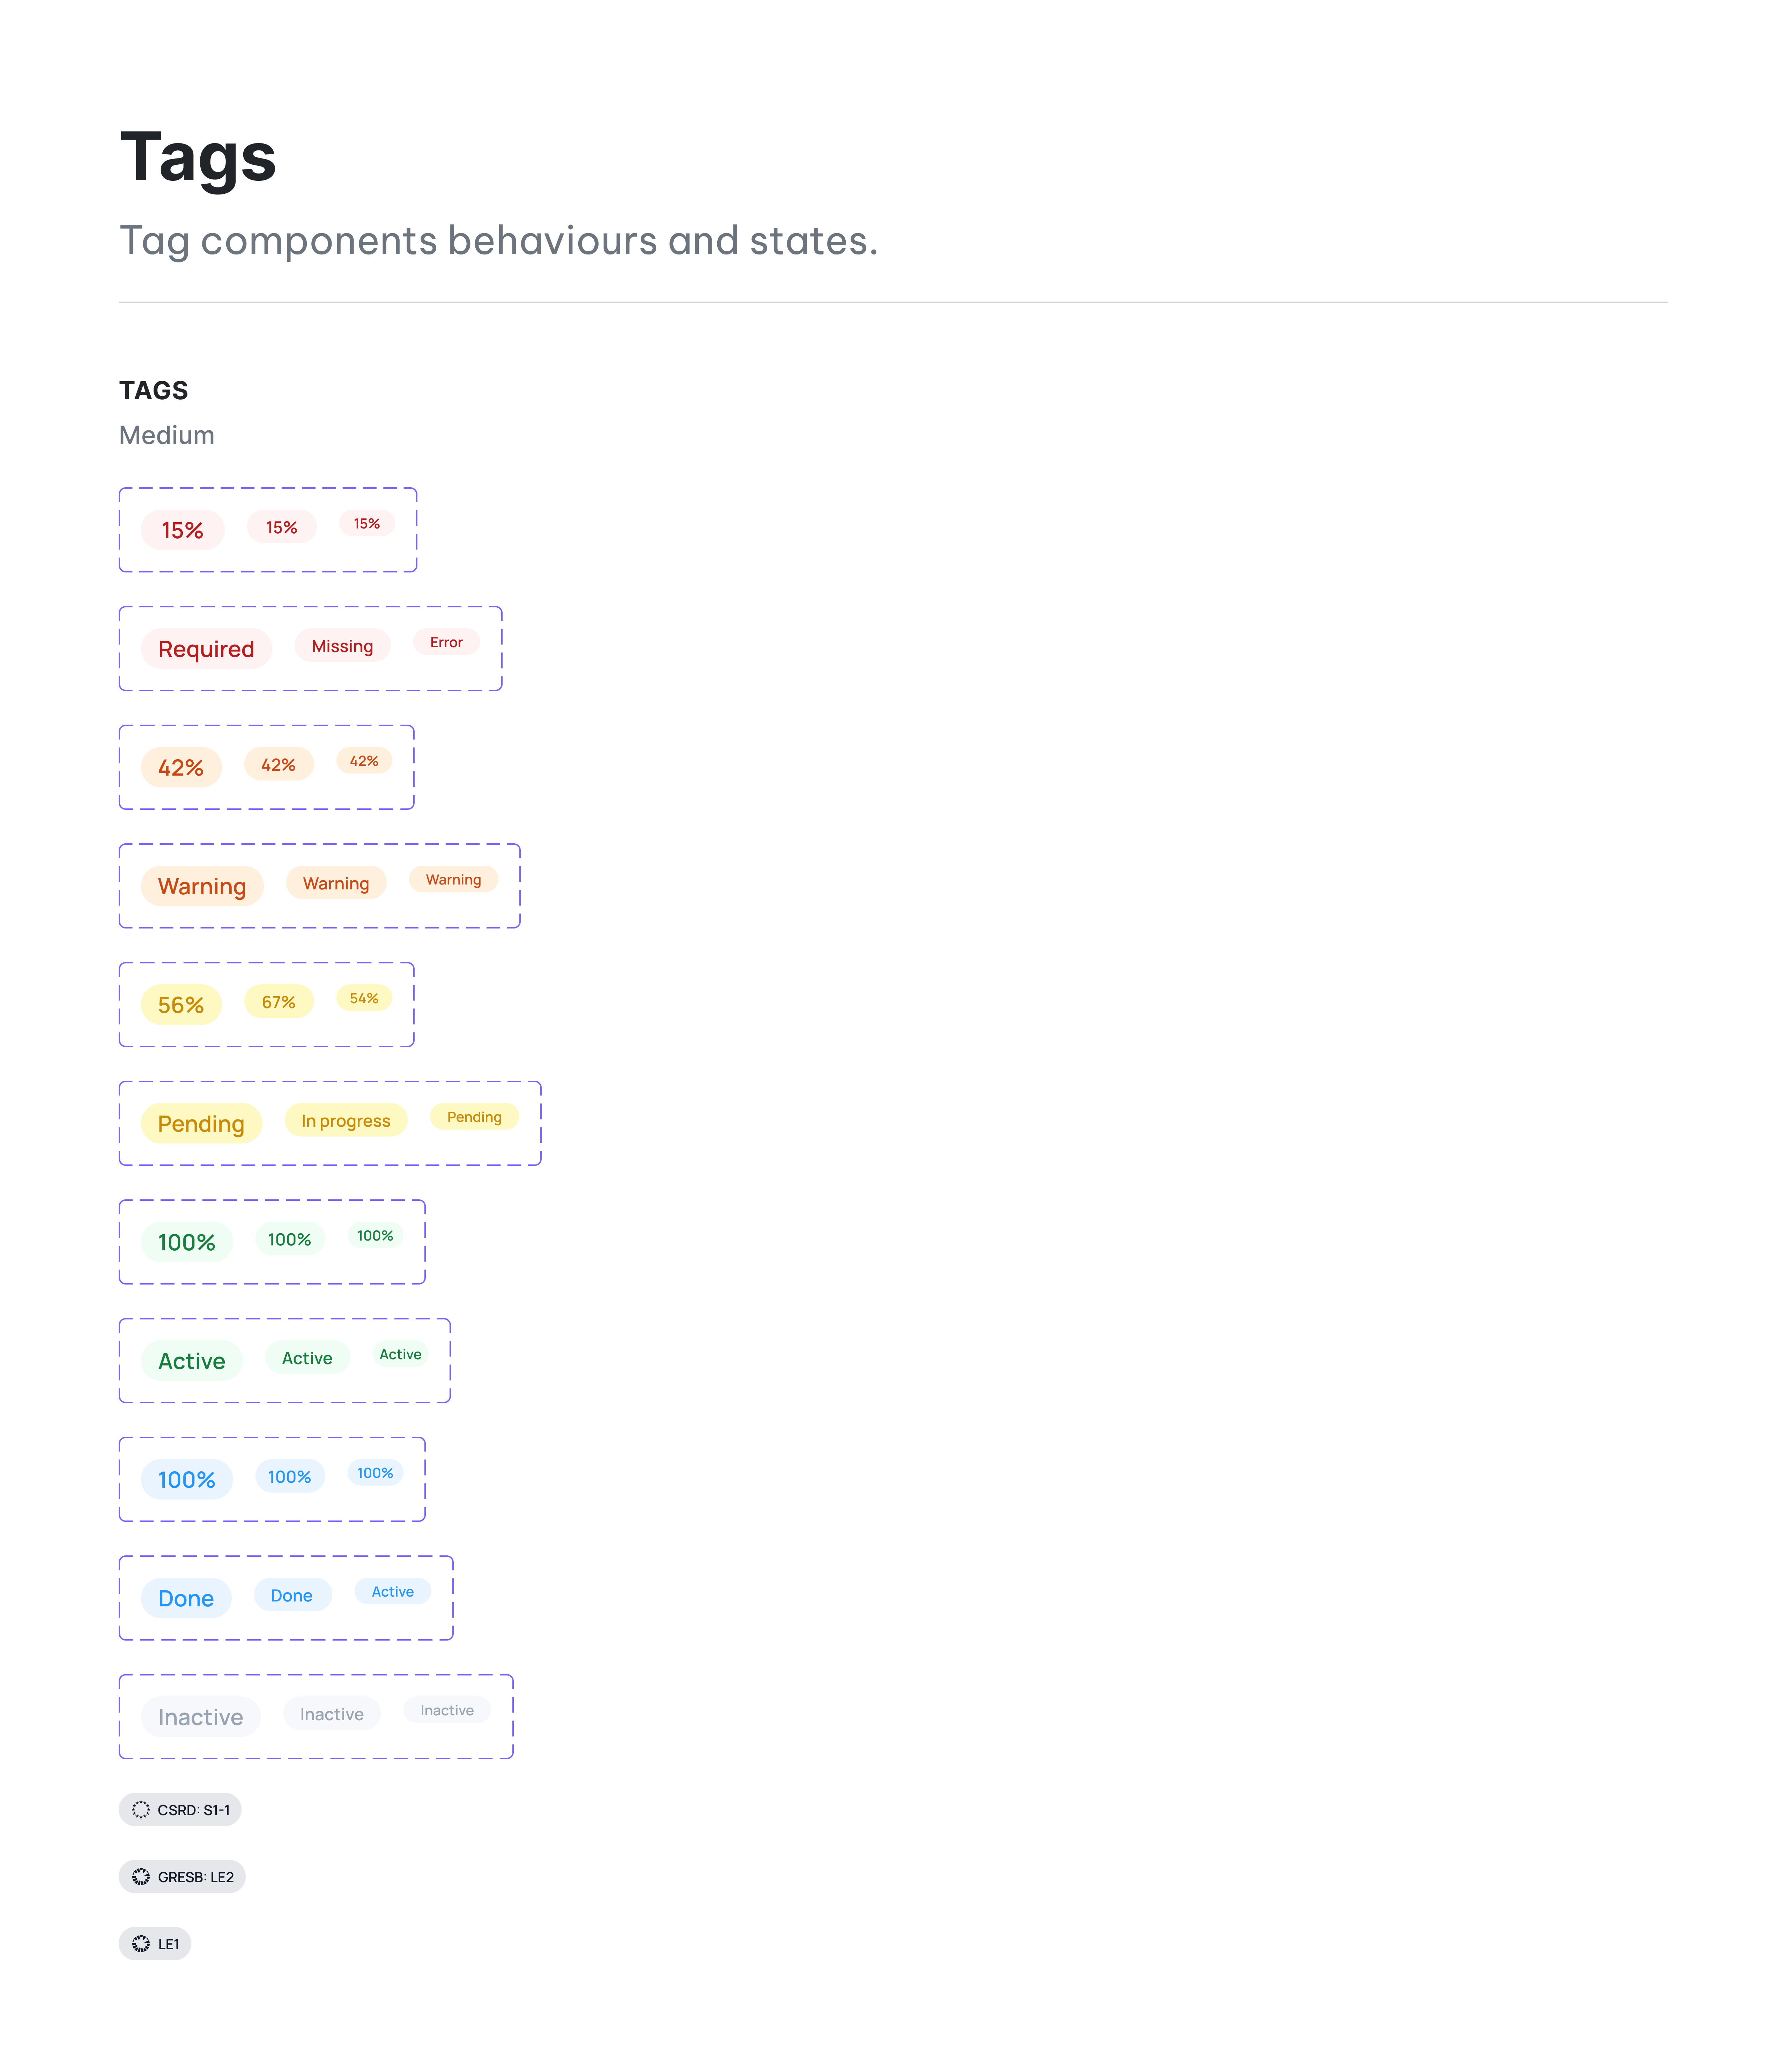
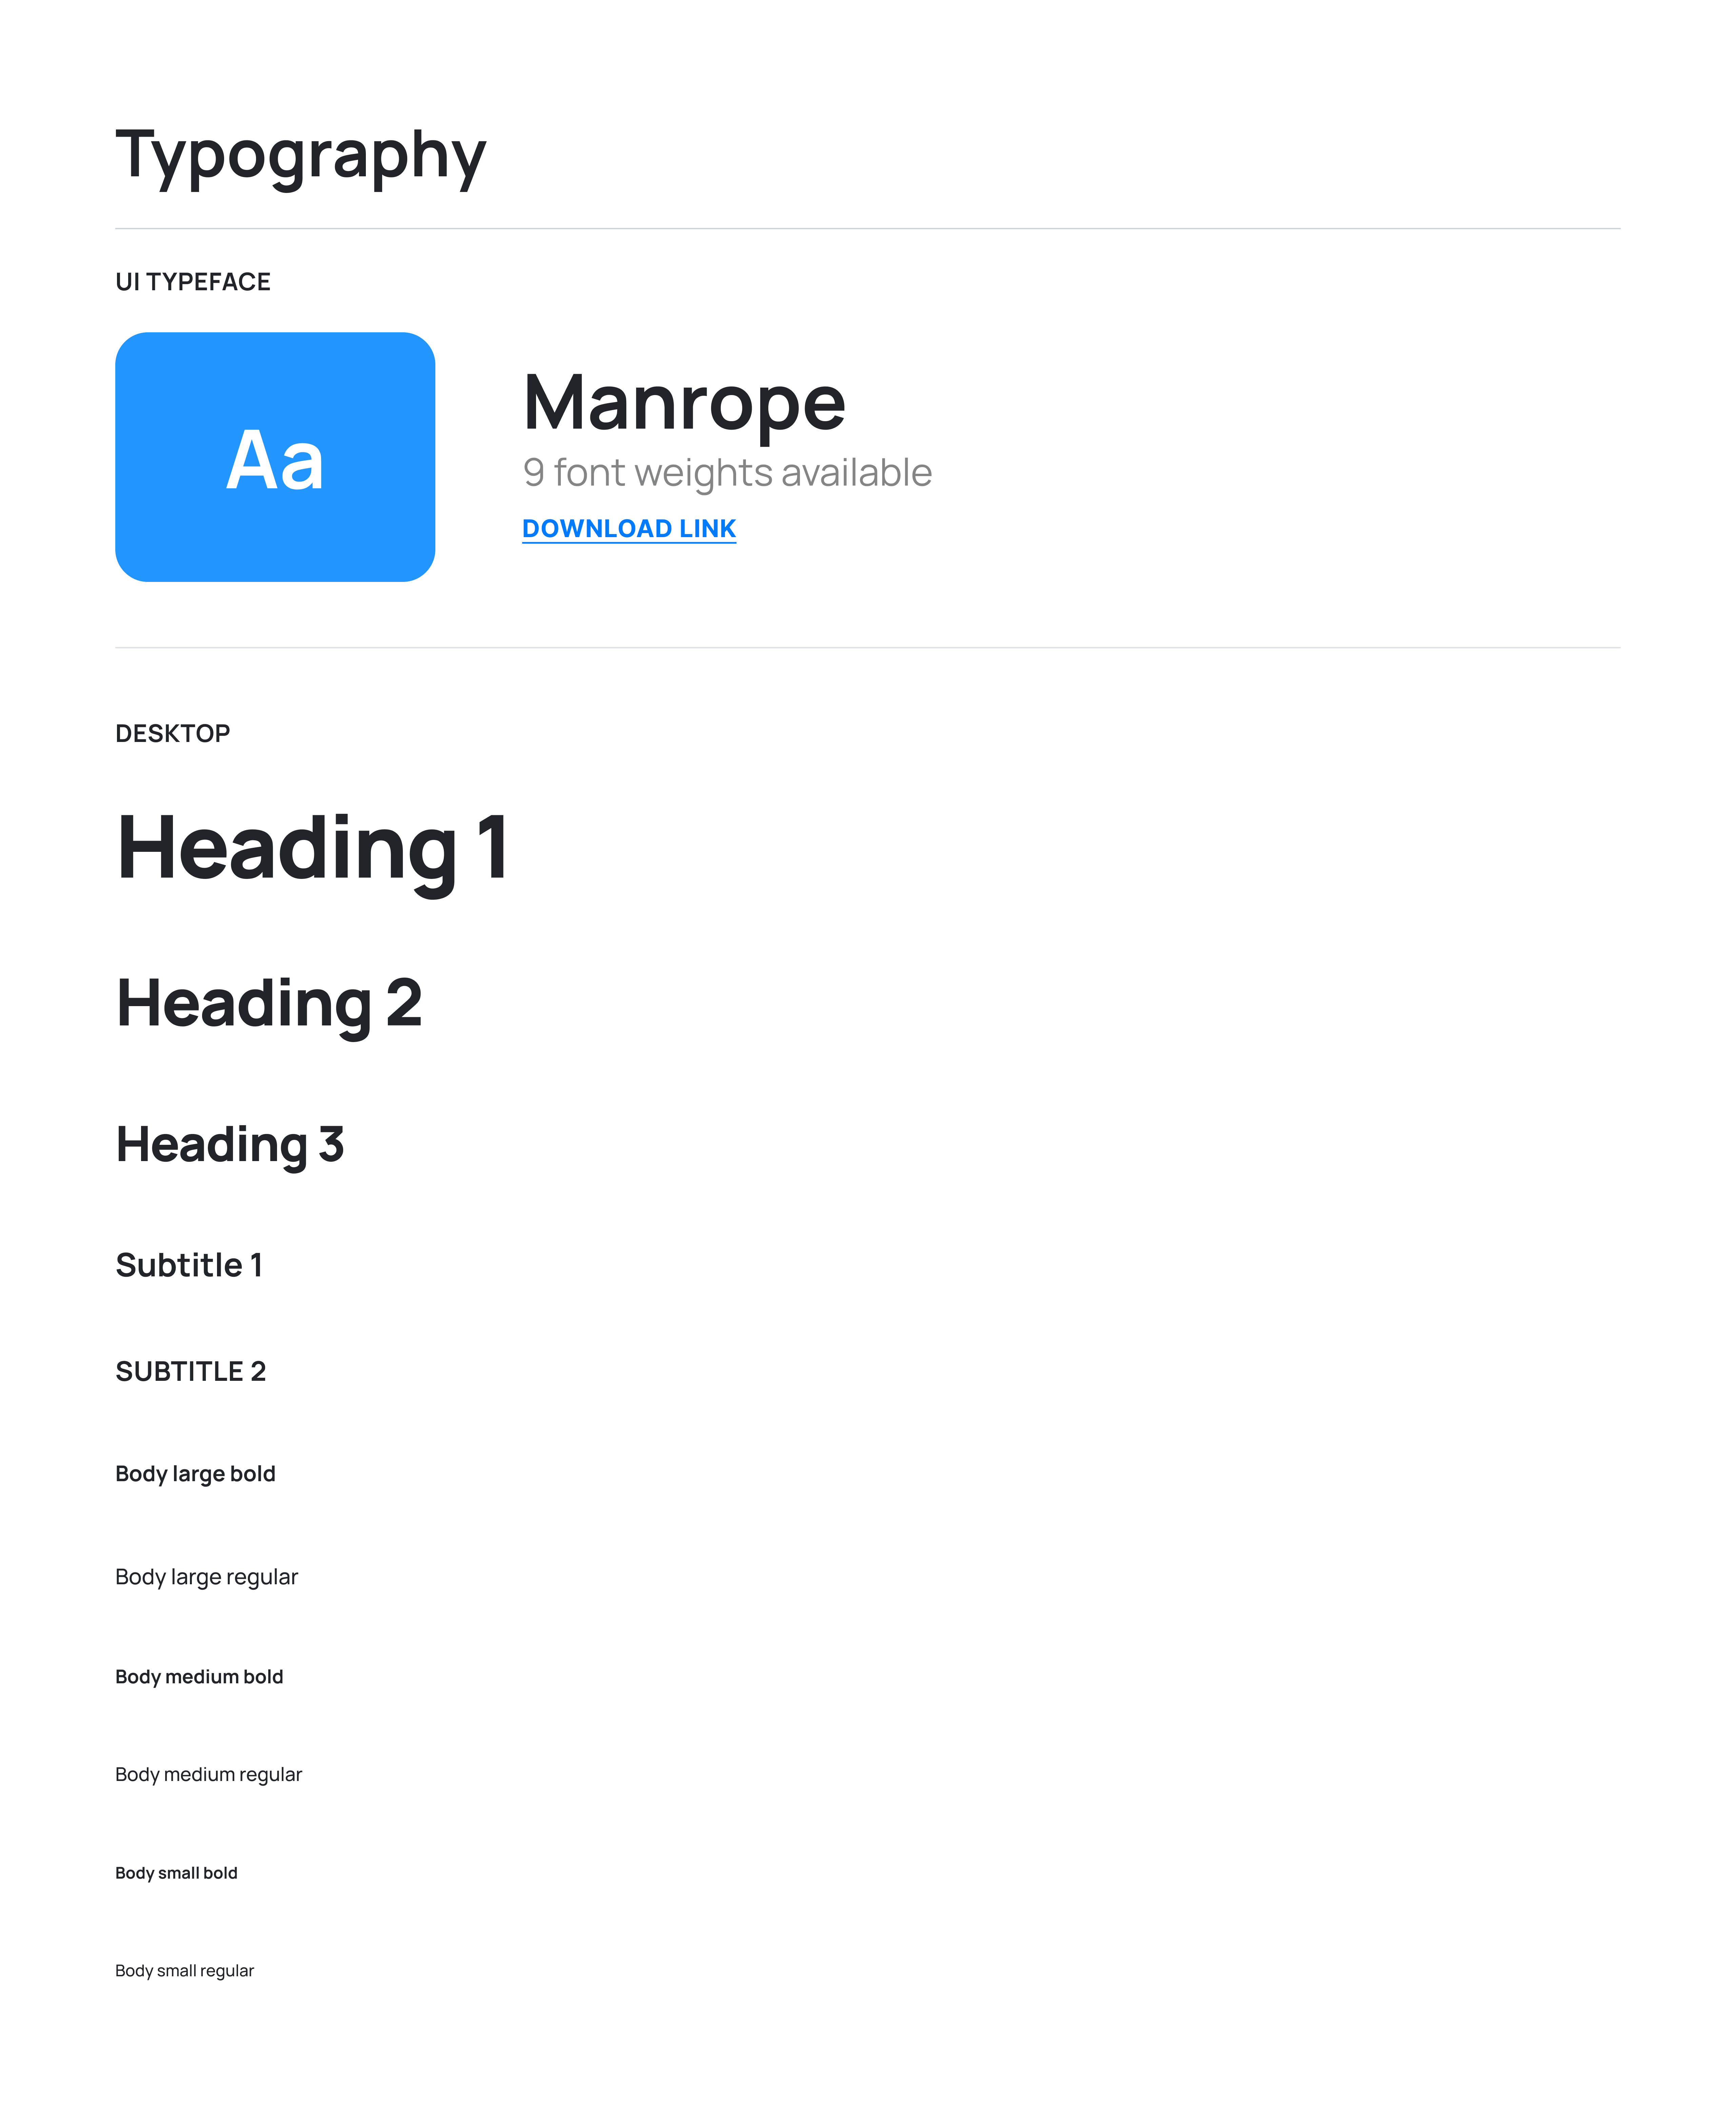
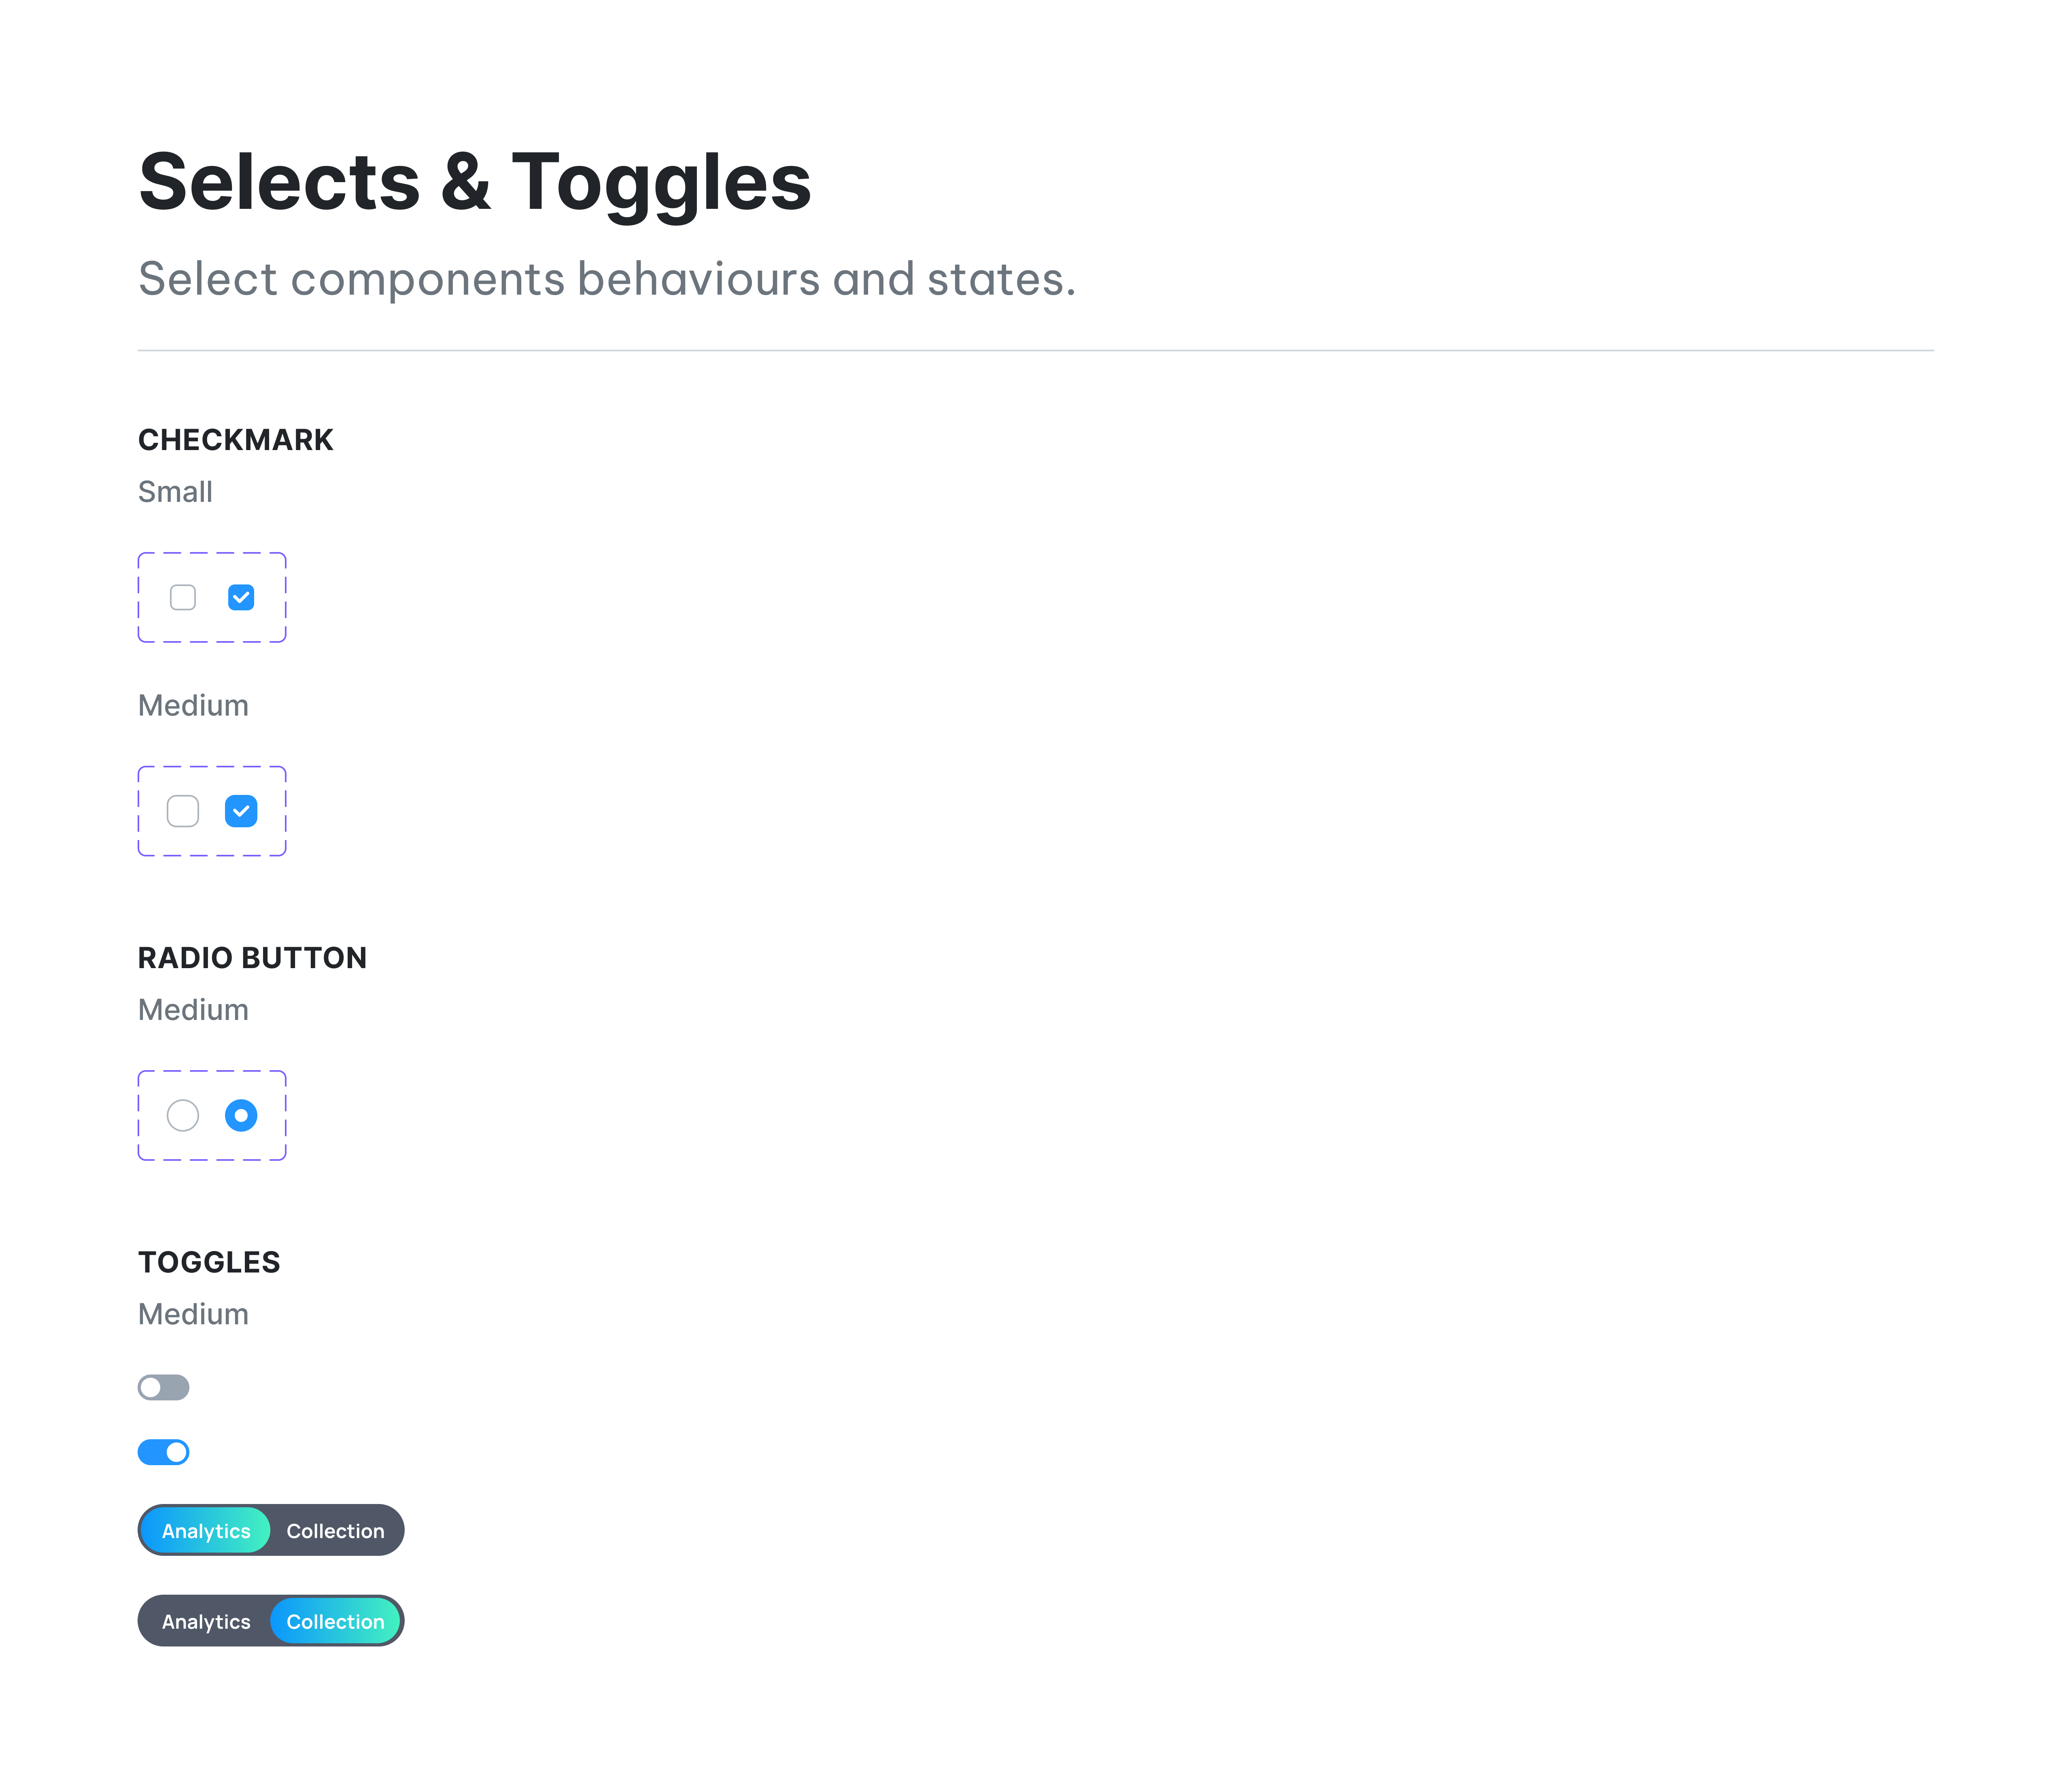
V. DESIGN SYSTEM
I began building Scaler's design system my first week working there. I documented all of the existing design within the platform and actively maintained the system during my time there. Below are some of the documents from the system.
2024
2023
2022
2021